

What is a trophic level diagram and how to interpret it
The concept of trophic level diagram is essential in biology and helps explain real-world biological processes and exam-level questions effectively.
Understanding Trophic Level Diagram
Trophic level diagram refers to a visual representation showing the different steps or levels in a food chain or food web, starting from primary producers at the base and moving up to various consumers and finally decomposers. This concept is important in areas like ecosystem energy flow, ecological pyramids, and food web structure. Understanding it helps students accurately answer diagram-based questions in exams and grasp how energy transfers in nature.
Mechanism of Trophic Level Diagram
The basic mechanism involves grouping organisms in an ecosystem according to their feeding roles and energy sources:
- Primary producers (plants, algae) form the first trophic level by making their own food from sunlight.
- Primary consumers (herbivores) eat producers.
- Secondary consumers (small carnivores/omnivores) eat primary consumers.
- Tertiary consumers (larger carnivores) eat secondary consumers.
- Decomposers break down dead material, recycling nutrients.
Trophic level diagrams are commonly shown as pyramids or stepwise charts to visualize these relationships and the loss of energy as you go up each level.
Step-by-Step Explanation of Each Trophic Level
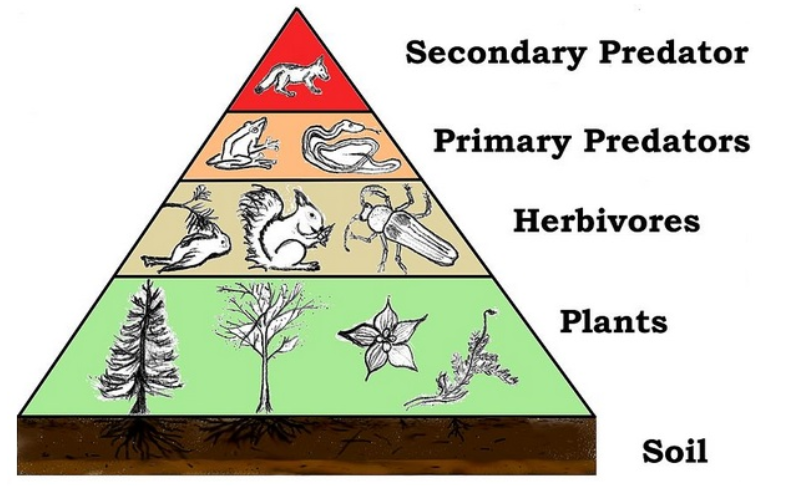
Let’s break down the main levels typically displayed in a trophic level diagram:
- Producers (First Trophic Level): Green plants, algae, and some bacteria. They use sunlight to make food via photosynthesis.
- Primary Consumers (Second Trophic Level): Herbivores like deer, rabbits, and insects. They eat producers.
- Secondary Consumers (Third Trophic Level): Small carnivores or omnivores like frogs and sparrows that eat herbivores.
- Tertiary Consumers (Fourth Trophic Level): Larger carnivores such as snakes and owls. They eat secondary consumers.
- Decomposers: Fungi and bacteria that break down dead organisms and return nutrients to the soil. Sometimes, decomposers are shown at each trophic level.
Energy Flow in Trophic Level Diagrams
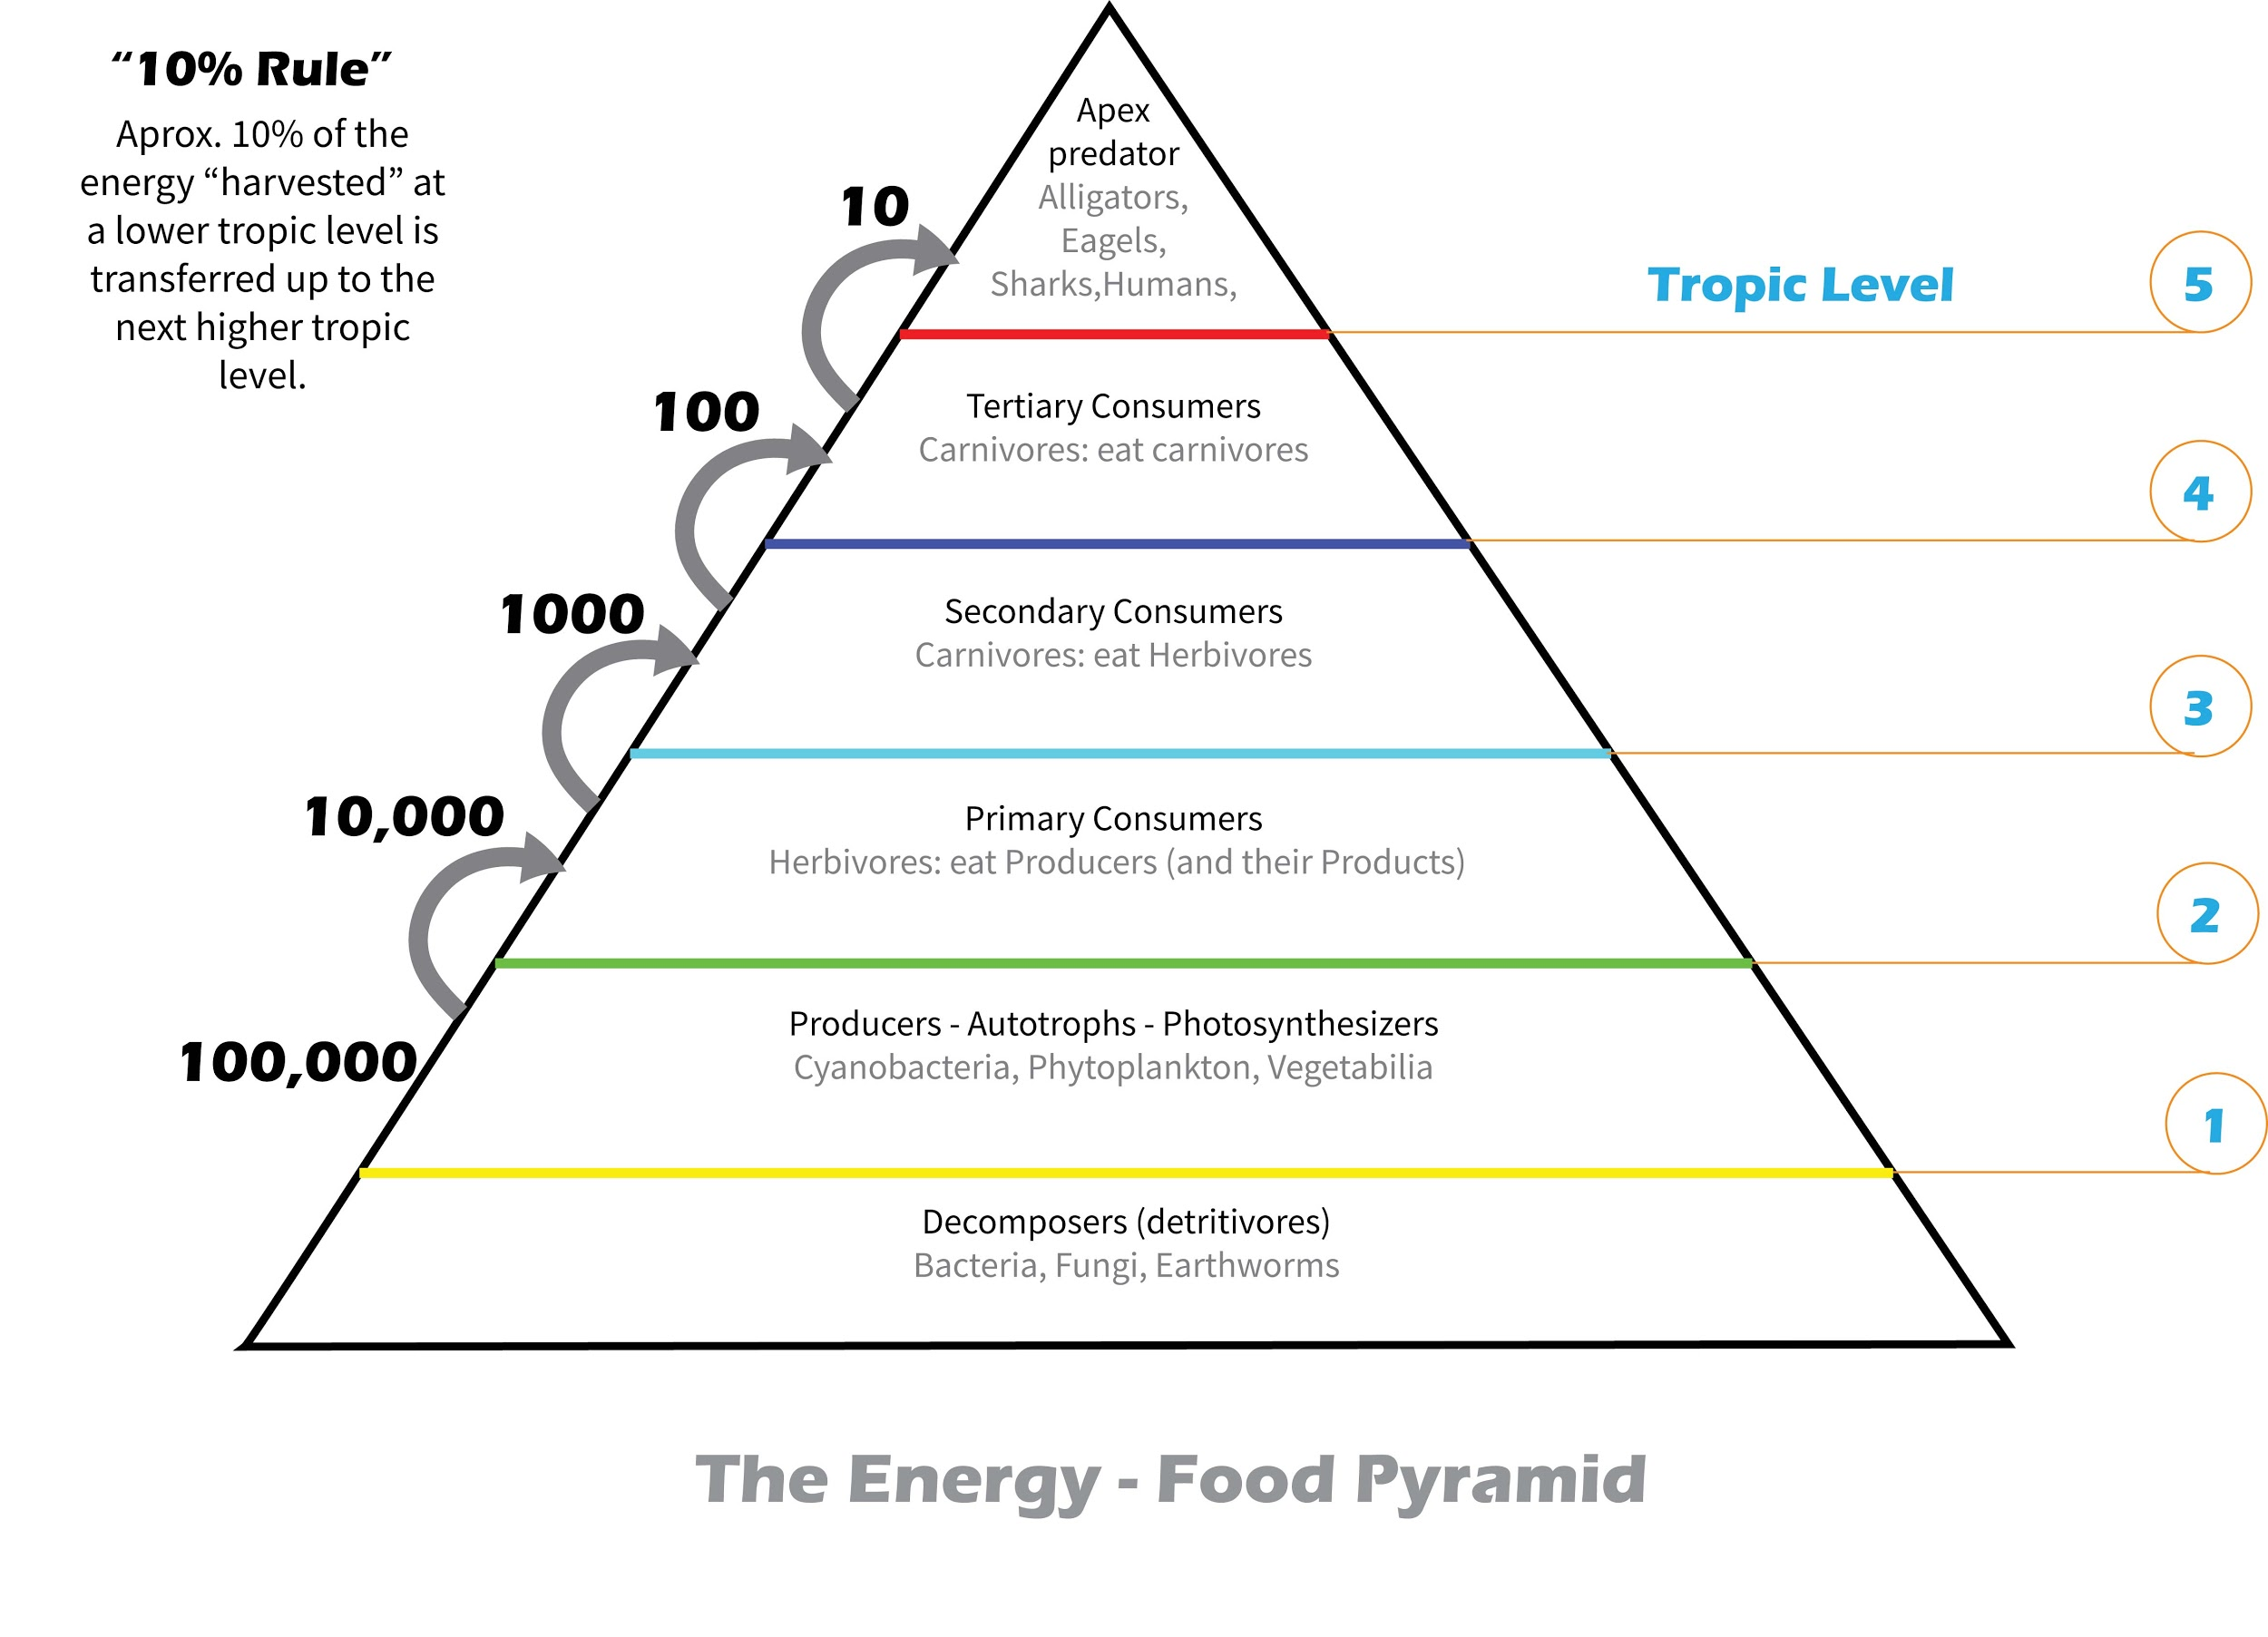
A fundamental idea shown by a trophic level diagram is the flow of energy in an ecosystem. Energy flows from the sun to producers, then to each higher trophic level. At every step, some energy is lost as heat, so only about 10% passes from one level to the next. That’s why pyramids are widest at the base and narrow at the top. This pattern is called the 10% law and is key in environmental studies and CBSE/ICSE biology.
Trophic Level Diagram Table
Here’s a helpful table to understand the different levels in a trophic level diagram:
| Trophic Level | Role | Examples |
|---|---|---|
| 1. Producers | Make food from sunlight | Plants, algae, phytoplankton |
| 2. Primary Consumers | Eat producers | Cow, rabbit, grasshopper |
| 3. Secondary Consumers | Eat primary consumers | Frog, small bird |
| 4. Tertiary Consumers | Eat secondary consumers | Snake, hawk |
| Decomposers | Break down dead matter | Bacteria, fungi |
Food Chain vs Food Web in Trophic Level Diagram
Trophic level diagrams can represent food chains (simple, single path of energy flow) or food webs (network of multiple food chains). In food webs, some organisms may occupy more than one trophic level based on their varied diet (for example, humans can be both primary and secondary consumers). Understanding the distinction helps to avoid confusion in diagrams.
| Food Chain | Food Web |
|---|---|
| Linear path of energy | Interconnected chains |
| Simple trophic levels | Organisms occupy multiple levels |
| Easier to draw | More complex, realistic |
Sample Practice Questions – Trophic Level Diagram
- Draw and label a simple trophic level diagram for a grassland ecosystem.
- Explain 'energy flow is unidirectional' in a trophic level diagram.
- List and describe the main trophic levels with suitable examples.
- Differentiate between a food chain and a food web using diagrams.
Common Mistakes to Avoid
- Missing labels for each trophic level in the diagram.
- Placing decomposers at the wrong level.
- Forgetting about energy loss at each step.
- Mixing up food chain and food web diagrams in your answers.
Real-World Applications
The concept of trophic level diagram is used in fields like ecology, environmental science, conservation, and biological research. Accurate diagrams help in ecosystem management, agriculture, and understanding human impact on nature. Vedantu explains these concepts with practical examples to help students build strong answers and real-world awareness.
In this article, we explored trophic level diagram, its key processes, real-life significance, and how to solve questions based on it. To learn more and build confidence, keep practicing with Vedantu.
Explore Related Topics
- Biotic and Abiotic
- Nutrition in Plants
- Nutrition in Animals
- Herbivores and Carnivores
- Food Web
- Energy Flow in Ecosystem
- Difference Between Grazing and Detritus Food Chain
- Our Environment
- Ecosystem
- Ecological Pyramid and Its Types
- Biogeochemical Cycle


FAQs on Trophic Level Diagram and Energy Flow in Ecosystems
1. What is a trophic level diagram?
A trophic level diagram is a visual representation that shows the feeding positions of organisms in a food chain or food web. It organizes organisms based on how they obtain energy.
- Producers form the first trophic level.
- Primary consumers occupy the second level.
- Secondary and tertiary consumers occupy higher levels.
- Arrows indicate the direction of energy flow.
2. What are the different trophic levels in an ecosystem?
The main trophic levels in an ecosystem are producers, primary consumers, secondary consumers, and tertiary consumers.
- Producers (Autotrophs) – Plants and algae that make food by photosynthesis.
- Primary consumers – Herbivores that eat producers.
- Secondary consumers – Carnivores that eat herbivores.
- Tertiary consumers – Top predators that eat other carnivores.
- Decomposers – Break down dead organisms and recycle nutrients.
3. How does energy flow in a trophic level diagram?
Energy flows in one direction in a trophic level diagram, from producers to higher-level consumers.
- Energy originates from the Sun.
- Producers convert solar energy into chemical energy.
- Energy passes to primary, secondary, and tertiary consumers.
- Only about 10% of energy is transferred to the next level.
4. Why is only 10% of energy transferred between trophic levels?
Only about 10% of energy is transferred to the next trophic level because most energy is lost as heat and used in metabolic activities.
- Energy is used for respiration and movement.
- Some energy is lost as heat.
- Not all biomass is consumed or digested.
5. What is the difference between a trophic level diagram and a food chain?
A food chain shows a single linear pathway of energy flow, while a trophic level diagram groups organisms based on feeding positions across chains.
- A food chain shows "who eats whom" in sequence.
- A trophic level diagram categorizes organisms into levels like producers and consumers.
- Trophic diagrams can represent multiple chains within a food web.
6. Can you give an example of a trophic level diagram in a grassland ecosystem?
A grassland trophic level diagram shows energy flow from grass to herbivores and then to predators.
- First trophic level: Grass (producer).
- Second trophic level: Grasshopper (primary consumer).
- Third trophic level: Frog (secondary consumer).
- Fourth trophic level: Snake or Hawk (tertiary consumer).
7. What role do decomposers play in a trophic level diagram?
In a trophic level diagram, decomposers break down dead organisms and recycle nutrients back to the ecosystem.
- Examples include bacteria and fungi.
- They act on organisms from all trophic levels.
- They release nutrients into the soil for reuse by producers.
8. Why are there fewer organisms at higher trophic levels?
There are fewer organisms at higher trophic levels because energy availability decreases at each level.
- Only about 10% of energy passes to the next level.
- Less energy supports less biomass.
- Top predators require large territories and prey populations.
9. How is a trophic level diagram related to an ecological pyramid?
A trophic level diagram shows feeding positions, while an ecological pyramid shows the quantity of energy, biomass, or organisms at each level.
- Pyramid of energy shows energy transfer.
- Pyramid of biomass shows total mass of organisms.
- Pyramid of numbers shows population size.
10. What is the importance of a trophic level diagram in ecology?
A trophic level diagram is important because it helps explain energy flow, feeding relationships, and ecosystem stability.
- It shows how energy moves through producers and consumers.
- It helps predict the impact of removing a species.
- It explains why top predators are fewer in number.
- It supports understanding of food webs and ecological balance.


