


Phases of Bacterial Growth Curve for NEET Biology Students
Understanding the Bacterial Growth Curve is essential for NEET aspirants aiming to build a strong foundation in biology. The bacterial growth curve explains how bacteria multiply over time under optimal conditions and highlights key growth phases. Mastering this concept not only boosts your knowledge of microbiology but also supports your ability to answer NEET questions accurately. Grasping this fundamental topic lays the groundwork for tackling related concepts and MCQs in exams.
What is the Bacterial Growth Curve?
The bacterial growth curve represents the pattern of bacterial population growth in a closed system, such as a culture medium, over time. When bacteria are introduced into a fresh nutrient-rich environment, they undergo a series of distinct stages. These phases can be recorded graphically, depicting changes in cell number or biomass as time progresses. The curve is crucial for understanding microbial dynamics, population behavior, and the effect of environmental conditions on bacterial growth, all of which are important for NEET preparation.
Core Ideas of the Bacterial Growth Curve
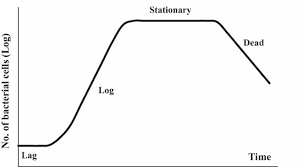
Key Phases of Bacterial Growth
There are four classic phases in the bacterial growth curve, each reflecting different physiological activities of the bacterial population:
- Lag Phase: Bacteria adjust to their new environment, do not multiply immediately, but increase metabolic activity as they prepare for cell division.
- Log Phase (Exponential Phase): Cells divide rapidly at a constant rate, leading to exponential population growth. This is when the bacteria are most active and sensitive to antibiotics.
- Stationary Phase: Growth rate slows and stabilizes as nutrient depletion and waste accumulation occur. The rate of new cell formation equals the rate of cell death.
- Death Phase (Decline Phase): Cells begin to die at an exponential rate due to unfavorable conditions, lack of nutrients, or toxicity by-products.
These distinct growth phases can be visualized in the following graph:
Important Sub-Concepts Related to Bacterial Growth Curve
Generation Time
Generation time is the period required for one complete round of binary fission - in other words, the time it takes for the bacterial population to double during the log phase. Different bacteria have different generation times. Fast-growing bacteria, like Escherichia coli, can double in about 20 minutes under optimal conditions.
Batch vs. Continuous Culture
A batch culture is a closed system where no new nutrients are added and waste is not removed once growth begins. Continuous culture allows fresh nutrients to be supplied and waste removed, which can keep cells in the log phase longer. For NEET, focus on the batch culture, as it directly relates to the classic bacterial growth curve.
Graph, Relationships, and Mathematical Aspects
The bacterial growth curve is typically plotted with cell number (or biomass) on the y-axis (log scale) and time on the x-axis. The curve’s shape and steepness reveal important biological information and exam-relevant concepts:
- During the log phase, the number of cells increases exponentially, represented mathematically as N = N0 2n, where N is the final number of cells, N0 is the initial number, and n is the number of generations.
- The slope of the curve during the log phase reflects the rate of population increase and is often used to calculate growth rate and generation time.
- Understanding the graph helps answer NEET questions about population dynamics and antibiotic susceptibility.
Key Features and Limitations of the Bacterial Growth Curve
- Provides a clear, visual understanding of bacterial population growth patterns
- Helps identify different physiological states of bacteria
- Limitations include applicability mainly to closed, laboratory systems, which don't always reflect real environmental conditions
- Does not represent the genetic variation or mixed-species populations typical of natural ecosystems
Importance of the Bacterial Growth Curve in NEET Preparation
The bacterial growth curve is a recurring subject in NEET due to its fundamental nature in microbiology and cell biology. It helps students understand microbial metabolism, population control, and factors affecting growth. Knowledge of the various phases provides insight into when bacteria are vulnerable to antibiotics - a common theme in exam questions. Understanding this concept lays the groundwork for mastering related topics such as sterilization, pathogenicity, antibiotics action, and environmental microbiology, strengthening overall problem-solving abilities.
How to Study the Bacterial Growth Curve Effectively for NEET
- Start by carefully studying the definitions and characteristics of each growth phase.
- Practice drawing and labeling the bacterial growth curve and understand what each segment represents.
- Memorize the order and main events of each phase, using mnemonics or diagrams for quick recall.
- Solve NEET-style MCQs that test conceptual and graphical understanding of the growth curve.
- Revise related concepts like generation time, effect of nutrients, and impact of antibiotics during different phases.
- Use visual aids such as graphs and images (like 'Growth Curve: Detailed Phases') for better retention.
Common Mistakes Students Make with the Bacterial Growth Curve
- Confusing the sequence of growth phases or mixing up their characteristics
- Not understanding the difference between log phase (growth) and lag phase (adaptation)
- Ignoring the practical relevance of the stationary phase (e.g., endospore formation, antibiotic production)
- Misinterpreting the growth curve graph or failing to relate it to generation time and growth rate calculations
- Overlooking the environmental and nutrient factors that influence the different phases
Quick Revision Points on Bacterial Growth Curve
- There are four classic phases: lag, log, stationary, and death
- Lag phase - adaptation but no real increase in number
- Log phase - fastest cell division and exponential growth
- Stationary phase - equilibrium between cell division and death
- Death phase - decline in population due to adverse conditions
- Generation time is shortest during the log phase
- Graph interpretation is crucial for NEET MCQs
- Exam tip: Link bacterial sensitivity to antibiotics with the log phase
FAQs on Bacterial Growth Curve for NEET: Complete Overview
1. What is a bacterial growth curve in NEET biology?
Bacterial growth curve in NEET biology is a graphical representation showing how a bacterial population increases with time under controlled conditions. It typically has four main phases:
- Lag phase – Adaptation without multiplication
- Log (exponential) phase – Rapid population increase
- Stationary phase – Growth rate equals death rate
- Decline (death) phase – Death rate exceeds growth
2. What are the four phases of the bacterial growth curve?
The bacterial growth curve consists of four main phases observed in NEET syllabus biology. These are:
- Lag phase – Bacteria adjust to their new environment with little or no cell division.
- Log (exponential) phase – Rapid cell division occurs, and population size doubles regularly.
- Stationary phase – Nutrients become limited; cell growth rate slows and equals the death rate.
- Decline (death) phase – Cells die at a steady rate due to depletion of nutrients and accumulation of waste.
3. Why is the lag phase important in the bacterial growth curve?
The lag phase is significant because bacteria adapt and prepare for future division.
- Bacteria synthesize enzymes, proteins, and other molecules needed for growth.
- There is no immediate increase in cell number.
- It helps cells adjust to a new environment or medium.
4. What happens during the log phase of bacterial growth?
During the log (exponential) phase, bacteria multiply at their maximum rate.
- Cell division is constant and rapid.
- Population doubles at regular intervals (generation time).
- Nutrients are in excess; waste products are minimal.
5. How can the stationary phase of bacterial growth be explained?
The stationary phase occurs when the rate of bacterial cell growth equals the rate of cell death.
- Nutrient depletion and accumulation of toxic products slow growth.
- Population size remains constant.
- Cells may become more resistant or form spores.
6. What causes the death phase in the bacterial growth curve?
The death phase is caused by exhaustion of nutrients and buildup of harmful metabolic products.
- Bacteria die at a faster rate than they multiply.
- Population declines steadily.
7. What factors affect the bacterial growth curve in NEET topics?
Factors influencing the bacterial growth curve include:
- Temperature – Each species has optimum, minimum, and maximum growth temperatures.
- pH level – Affects enzyme activity and cell metabolism.
- Oxygen availability – Aerobic vs. anaerobic bacteria responses.
- Nutrient supply and waste accumulation
8. How does the bacterial growth curve relate to antibiotic action? (NEET context)
Antibiotics are often most effective during the log phase of the bacterial growth curve.
- Rapidly dividing cells are more susceptible to antibiotics.
- In stationary or death phase, bacteria may show resistance or reduced sensitivity.
9. Define generation time and its significance in the bacterial growth curve for NEET exams.
Generation time is the time taken for a bacterial population to double during log phase.
- It varies among species (e.g., E. coli: ~20 minutes under optimal conditions).
- Shorter generation times mean faster growth rates.
10. Draw and label a typical bacterial growth curve for NEET.
A typical bacterial growth curve shows four primary phases when plotted as cell number vs. time:
- Lag phase – flat at the beginning
- Log phase – steep upward slope
- Stationary phase – plateau
- Decline (death) phase – downward slope