


An Overview of Cbse Class 12 Micro Economics Notes Chapter 4
Market:
It is a mechanism or arrangement that brings buyers and sellers of a commodity or service together and allows them to complete the act of selling and buying the commodity or service at mutually agreed prices.
Perfect competition:
It is a market structure in which a large number of buyers and sellers compete for the same products at the same price, with firms free to enter and exit and no government control.
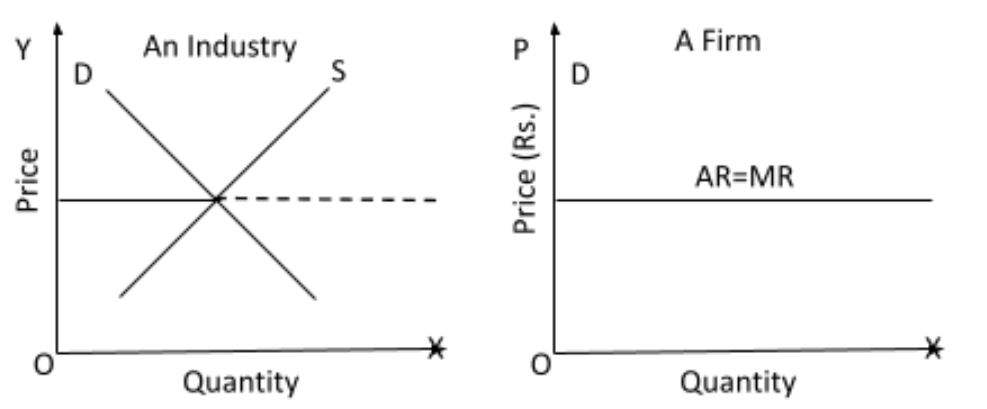
Since price remains constant in the presence of perfect competition, the average and marginal revenue curves coincide, i.e., they become equal and parallel to the x-axis.
Price is determined by the industry under perfect competition based on market forces of demand and supply.
No single company can influence the product's price.
A company can only make decisions about output. As a result, the industry sets the price, and the firm accepts the price.
Features of Perfect Competition:
Large number of sellers. In a perfectly competitive market, there are a large number of small sellers selling homogeneous products to their buyers. The number of sellers is so large that no single firm can influence the overall market price or market supply. Hence no individual seller by altering its sale or supply can impact the overall market supply or market price.
Homogeneous Products: Each company creates and sells a uniform product. i.e., one firm's product cannot be distinguished from the product of any other firm.
Price Taker: In this form of market, the firm is a price taker, and not a price maker, as the share of each firm in the market is so insignificant as to impact the price of the commodity. Firms have the freedom to enter and quit the market at any time.
Perfect knowledge about the markets: It implies that the consumers and producers have all the relevant market-related information. Producers will not be ready to sell at any price below the market price while consumers will not be ready to buy at any price above the existing market price. This eliminates the price differences in the market and helps in quickly achieving the equilibrium level of the price level.
Free entry: Free Entry means that there are no obstacles to the entry of new firms into the market. When the existing businesses are earning abnormal profits, the new firms are influenced due to the profit and they enter the industry. This increases market supply which leads to a fall in market price and profits.
Free exit: Freedom to exit means that there are no obstacles that stop the existing firms from stepping down from the market. The firms attempt to quit when they are dealing with losses. As the firms start to exit, market supply drops, which begins to rise in market price and consequently decreases in losses. The firms do not stop leaving till the losses are eliminated and each remaining firm will be earning just the normal profits.
Perfect Mobility: In a perfectly competitive market, the factors of production are perfectly mobile, and hence can be easily transferred from one firm to the other.
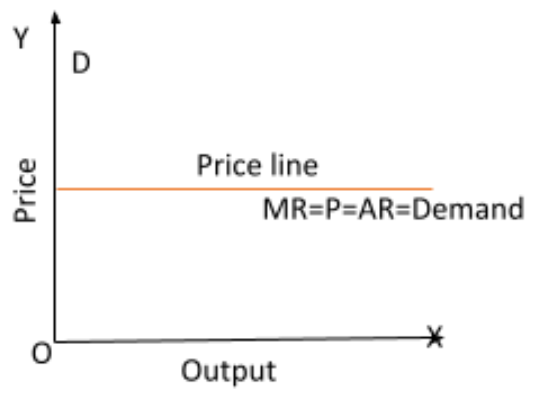
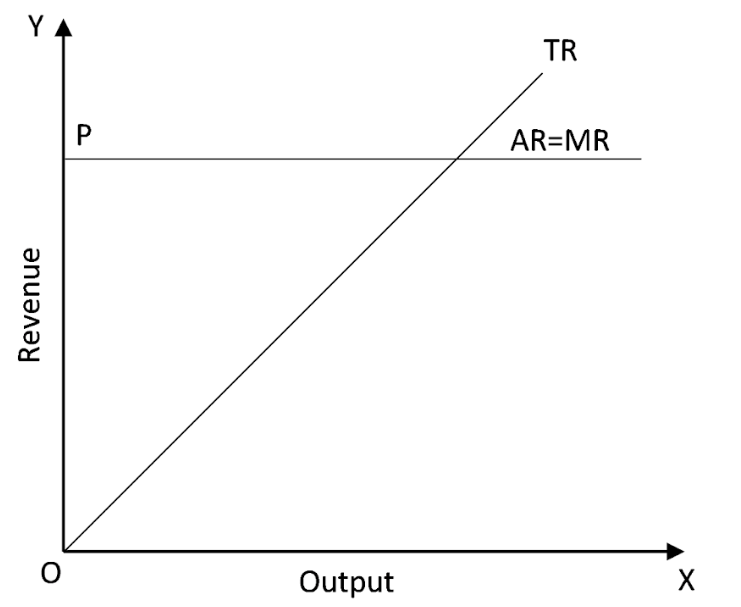
Price Line In Perfect Competition
The price line and demand curve for an individual firm in a completely competitive market are the same.
The line denotes that a company's goods and services may be sold at the current price.
The price line in such a market is a horizontal straight line that depicts that the firm can sell any quantity of a product only at a certain price. If the firm tries to change the price, the overall demand falls to zero, because as there are a large number of small firms, no firm is capable enough to impact the overall price or supply.
The price line is shown as below:
Revenue
It is the revenue received by a company from the sale of a product or service to its clients.
Total Revenue (TR)
The price (p) of the commodity is multiplied by the amount produced and sold to determine revenue (q).
Total revenue (TR) is defined as
$TR=p\times q$ in algebraic form.
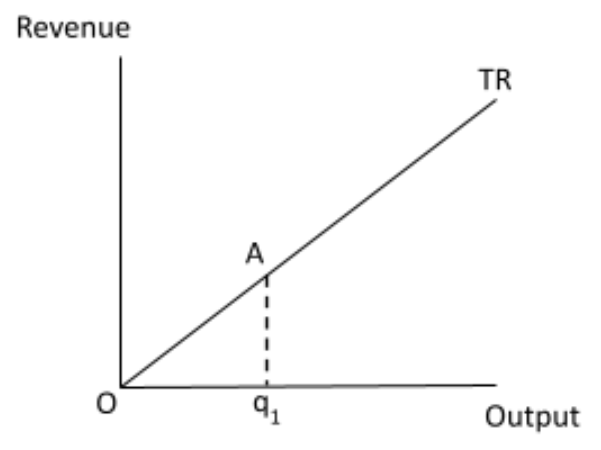
Total Revenue Curve
The relationship between the total revenue earned by a firm for selling its output and the quantity of output sold is visually represented by a curve.
To determine economic profit and the profit-maximizing level of production, it is paired with a firm's total cost curve.
Average Revenue:
The income earned per unit of output is referred to as average revenue.
In other words, it is the profit earned by the seller on each unit of the commodity sold.
The average revenue of a company is calculated by dividing total revenue by total output.
\[{AR}=\frac{{TR}}{q}=\frac{p\times q}{q}=p\]
Marginal Revenue:
The revenue generated by selling an additional unit of a commodity is known as marginal revenue.
When an additional unit of a commodity is sold on the market, it results in a change in overall revenue.
The following equations can be used to describe the link between market price and marginal revenue:
$MR=\dfrac{\Delta TR}{\Delta Q}$
$M{{R}_{n}}=T{{R}_{n}}-T{{R}_{n-1}}$
Where
TR = Total Revenue
MR = Marginal Revenue
Q = Quantity
In a perfectly competitive market, the price equals marginal revenue, according to the preceding equation.
$MR=P{{Q}_{n}}-P{{Q}_{n}}$
The relationship between marginal revenue and pricing is depicted graphically as follows:
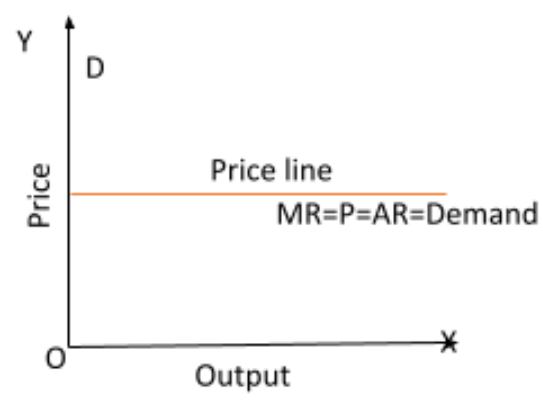
TR, MR and AR curves in Perfectly Competitive Market
Profit
The difference between revenue and expense is profit.
Profit is calculated as:
Profit = Revenue – Cost
Break-Even Point
When a company reaches break-even, it has covered all of its manufacturing costs.
As a result, a break-even point is defined as a condition in which TR- TC or AR- AC are equal. In this case, the company only makes standard earnings.
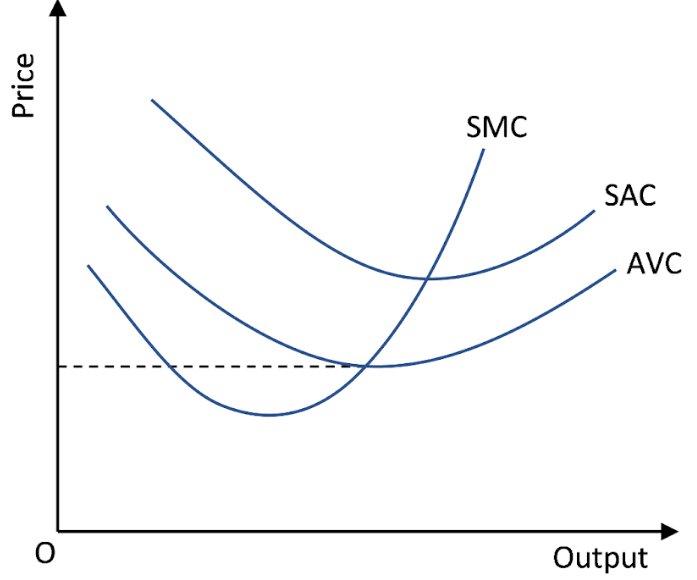
Shutdown Point
It occurs when a company's variable costs are barely covered, resulting in a loss of fixed costs of production.
As a result, a shutdown point is defined as when TR= TVC or AR= AVC.
Profit Maximisation or Profit equilibrium
When a producer maximizes earnings or minimizes losses, he is considered to be in equilibrium.
Profit maximisation condition:
MR Equals MC.
MC is rising, or MC should cut MR from below.
Supply:
The amount of a commodity that enterprises are able and willing to sell in the market in a particular period and at a specific price is referred to as supply.
Supply Schedule:
A supply schedule is a table that shows the amounts sold by a company at various prices while keeping technology and factor prices constant.
Supply Curve:
The supply curve of a firm depicts the amounts of output that the firm chooses to create in response to varied market price values while maintaining technology and factor prices constant.
Short-run Supply Curve of a Firm:
The supply curve of a firm informs us how much of a product a profit-maximizing firm is willing to produce at each price point.
In this, a firm's supply curve is less elastic because it cannot shift in response to changes in demand for goods and services.
Case 1: Price is greater than or equal to the minimum AVC
Assume the market cost price is P1, which is greater than the minimum AVC. To begin, we equalise P 1with SMC on the increasing part of the SMC curve, yielding the output degree Q1. It is also worth noting that the AVC in Q1 does not exceed the market cost price, P1.
As a result, at Q1, all three conditions in section 3 are satisfied. In the short run, the enterprise's output degree is equal to Q1 when the market cost price is P1.
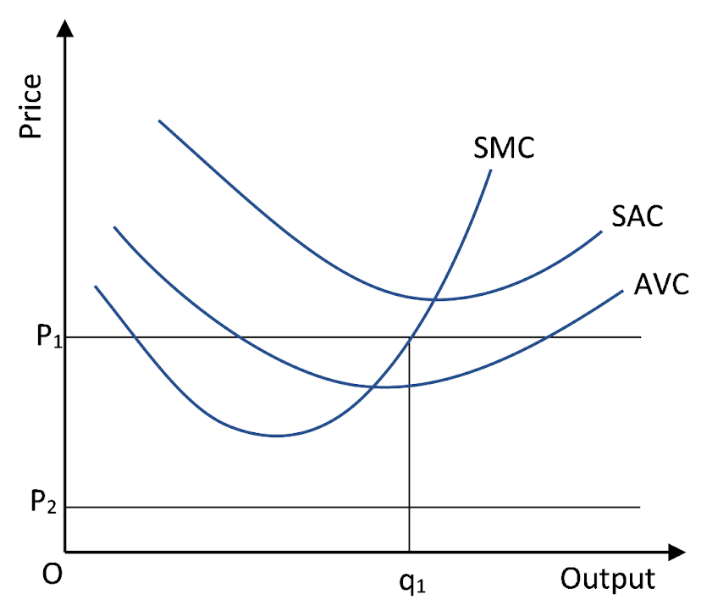
Case 2: Price is less than the minimum AVC
Presume the market cost price is P2, which is lower than the AVC minimum.
If a profit-maximizing firm produces a positive output in the short run, the market cost price, P2, has to be higher than or equal to the AVC at that output level.
The AVC clearly outperforms P2 in the image.
To put it another way, the company is unable to generate a profit. As a result, if the market price is P2, the enterprise produces no output.
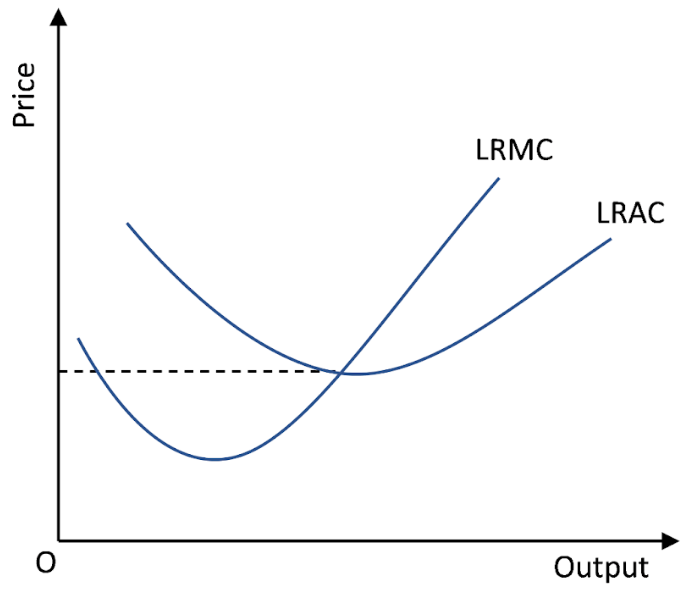
Long-run Supply Curve of a firm:
When all inputs are variable, the long-run supply is the supply of commodities available.
The supply curve, in the long run, is always more elastic than the supply curve in the short run.
In a u-shaped curve, the long-run average cost curve encompasses the short-run average cost curves.
With the addition of increasing long-run marginal cost curves, the supply curve is upward sloping.
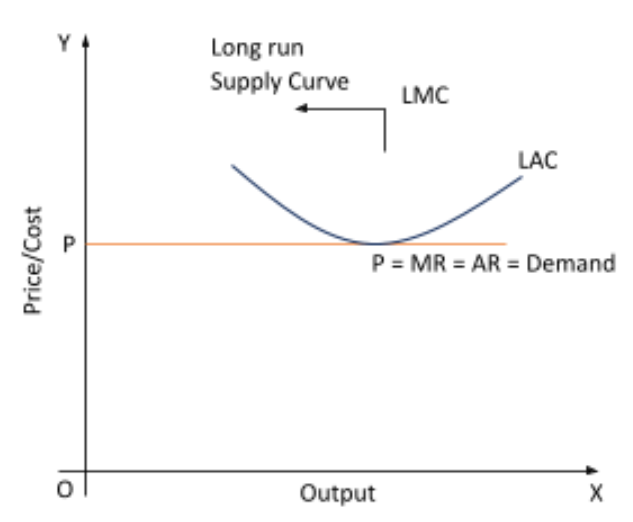
Case 1: Price greater than or equal to the minimum LRAC
Presume the market cost price is P1, which is greater than the minimum LRAC. We obtain the output degree Q1 by equating P1 with LRMC on the increasing part of the LRMC curve.
It's also worth noting that the LRAC in Q1 does not exceed the market cost price, P1.
As a result, at Q1, all three of the conditions are met. When the market cost price is P1, the firm's supplies are equal to Q1in the long run.
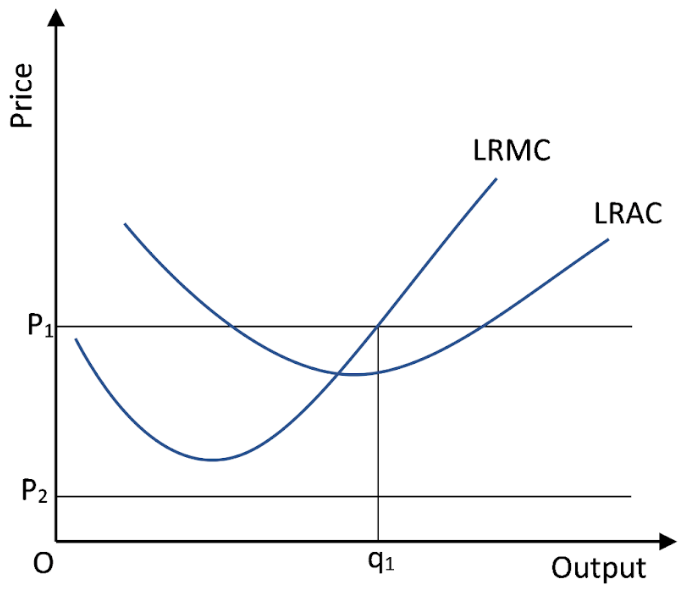
Case 2: Price less than the minimum LRAC
Assuming the market cost price is P2, which is lower than the LRAC minimum.
If a profit-maximizing firm produces a positive output over time, the market cost price, P2, must be larger than or equal to the LRAC at that production level.
In other words, the firm is unable to produce a positive result. As a result, when the market cost price is P2, the firm produces nothing. We reach an important conclusion by combining Cases 1 and 2.
The long-run supply curve of a business is the increasing section of the LRMC curve from and above the minimum LRAC, as well as the zero production for all cost prices less than the minimum LRAC.
Determinants of Supply Curve:
Cost of production: Since profit maximisation is the primary purpose of most private businesses. Higher production costs reduce profit, limiting supply. Input prices, salary rates, government regulation and taxes, and so on are all factors that influence production costs.
Technology: Technological advancements assist in lowering production costs and increasing profit, resulting in increased supply.
The number of vendors: The market supply grows as more sellers enter the market.
Price expectations for the future: If producers foresee future prices to be higher, they will want to hang onto their inventory and sell the products later, allowing them to profit from the higher price.
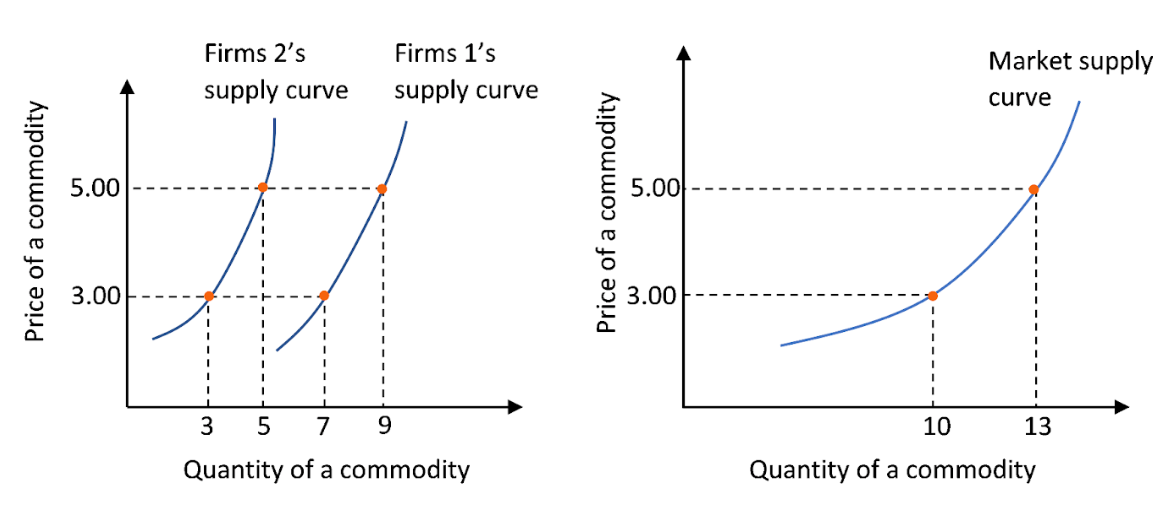
Market Supply Curve:
The market supply bend estimates the connection between total output and the normal peripheral cost of producing this output.
Price Elasticity of Supply:
The price elasticity of supply is a measurement of how sensitive a given good's quantity is to a change in price.
Measurement of Price Elasticity of Supply:
Price elasticity of supply curve,
${{e}_{n}}=\dfrac{Percentage\text{ }change\text{ }in\text{ }quantity\text{ }supplied}{Percentage\text{ }change\text{ }in\text{ }price}$
$\dfrac{\dfrac{\Delta Q}{Q}\times 100}{\dfrac{\Delta P}{P}\times 100}=\dfrac{\Delta Q}{Q}\times \dfrac{P}{\Delta P}$
Where
$\Delta Q$ = change in quantity of the good supplied to the market as market
$\Delta P$ = change in price of the good
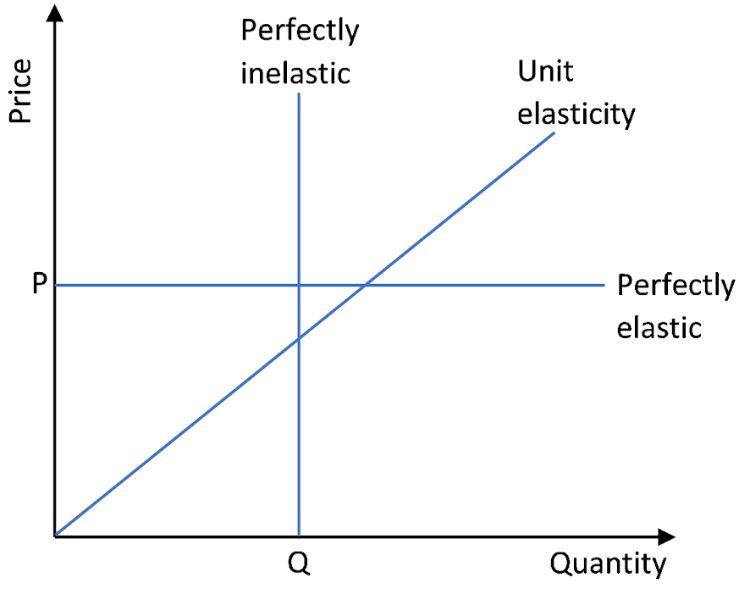
Extreme Cases of Price Elasticity of Supply:
Perfect elasticity supply $\left( {{e}_{s}}=\infty \right)$:
The extreme case of perfect elasticity is when the demanded quantity (Qd) or the supplied quantity (Qs) changes by an enormous amount in response to any change in price. The supply and demand curves are horizontal in both instances.
Perfect inelasticity supply $\left( {{e}_{s}}=0 \right)$:
If a given quantity of a service or commodity can be supplied at any price, it has a perfectly inelastic supply. The supply elasticity of such a service or commodity is zero. A straight line parallel to the Y-axis is a perfectly inelastic supply curve. This illustrates how supply remains constant regardless of price.
Equilibrium Price:
It is the point at which the supply of commodities equals the demand.
When a major index undergoes a period of consolidation or sideways motion, the forces of supply and demand are considered to be relatively equal, and the market is said to be in a condition of equilibrium.
Equilibrium Quantity:
When there is no scarcity or excess of a product on the market, it is said to be in equilibrium quantity.
When supply and demand meet, the quantity of an item that customers want to buy equals the quantity that producers are willing to produce.
Application of Demand Supply:
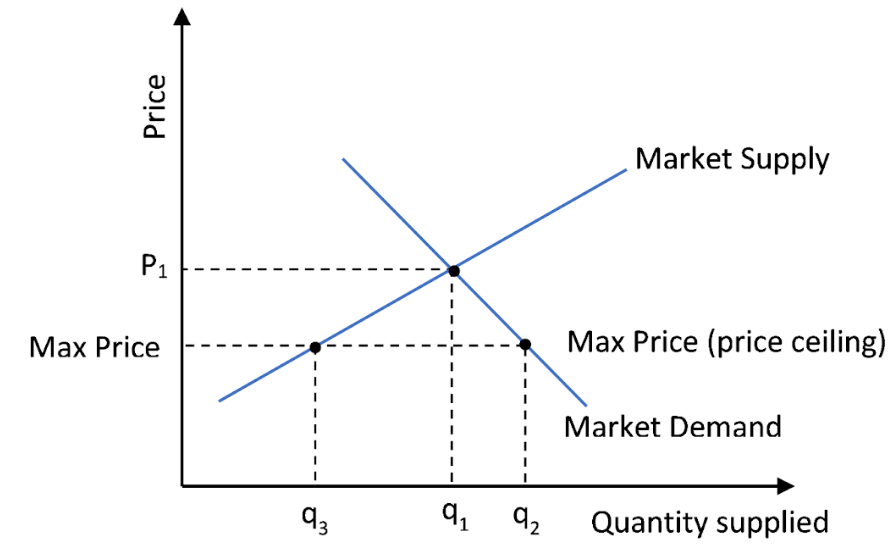
Maximum Price Ceiling:
This refers to the lowest price that sellers are permitted to charge in comparison to the equilibrium market price. When the demand for necessary products exceeds the supply, the government imposes a ceiling.
That is when there are shortages among consumers and the equilibrium price is excessively high. It is done by the government for the benefit of consumers. Rationing and dual marketing may be used to meet excess demand.
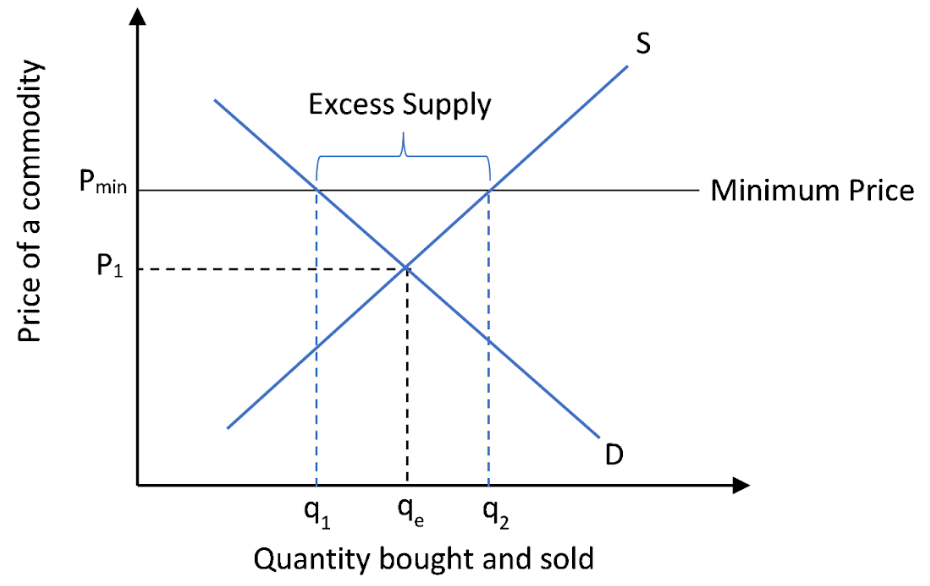
Minimum Price Ceiling:
This means that producers are not allowed to sell their goods below the price set by the government. If the government determines that the equilibrium price is too low for the produce it sets a price ceiling higher than the equilibrium price to protect producers from potential losses.
The price is also known as the minimum support price or the floor price. In most cases, the government purchases the extra supply at this price.
Technological Advancement on Supply Curve:
The marginal cost of production is reduced as technology advances. With the help of accessible factors of production, producers can generate significantly more goods and services.
The supply curve is anticipated to shift rightward and the marginal cost curves downward because of this circumstance.
Supply and technical growth have a beneficial relationship.
Technological advancements frequently result in lower production costs, allowing manufacturers to produce and sell more goods and services at the same price.
As a result, technological advancement is expected to boost supply, leading the supply curve to shift to the right.
Revision Notes for CBSE Class 12 Micro Economics Chapter 4 - Free PDF Download
Perfect Competition and Revenue: What is the Market?
An arrangement where buyers and sellers come in direct or indirect contact to sell/buy goods and services. The market refers to the entire region in which a product's buyers and sellers are in touch with each other to purchase and sell the commodity.
Perfect Competition
The market situation in which a large number of vendors compete to sell a homogeneous commodity at a price set by the market is perfect competition. In such instances, the market prevails at a uniform price. The industry itself decides this.
No individual company keeps the remote with reference to price. The commodity's supply and demand, combined from all sources i.e. the industry), helps to determine the price. This price clearly has to be agreed by the company. The business is a price taker in a nutshell and the market is a price producer.
Revenue and Perfect Competition
Uniform rates exist in a perfect competition that are set by the market. The demand curve is completely elastic in the presence of such situations, so the AR curve is a straight line parallel to the X-axis.
In addition, each unit of the product has the same price. The revenue received from selling each additional unit is therefore always equal to the price of the commodity. It's even possible to assume that AR=MR.
What is Supply?
Supply refers to the amount, at a given price of a commodity that a company is willing and able to supply at a given time.
Supply Curve
The supply curve is called the graphical presentation of the relationship between price and the supply of goods. The supply curve slopes upwards, unlike the demand curve.
Determinants of the Market Supply Curve
Number of Firms in the Market: Market supply is the aggregate amount of individual supply contributions. As a result, if the number of firms on the market increases, there will certainly be a rise in overall supply or market supply
Future Expectations regarding Price: If sellers expect a price increase, they would shorten the supply to hold back their goods and will boost the supply as prices rise
Transportation and Communication: Proper development of infrastructures, such as developing the means of transport and communication, helps to ensure a sufficient supply of goods
Kinds of Elasticities of Supply
The price elasticities of supply are categorized into five types:
1. Perfectly Elastic Supply: A commodity is said to have a perfectly elastic supply if it has an unlimited supply at a particular price and even a small shift in that price brings the supply down to zero
2. Perfectly Inelastic Supply: In response to any change in the price, a perfectly inelastic supply remains unmoved
3. Highly Elastic Supply: If the percentage change in the quantity supplied is greater than the percentage change in price, it is said that the supply is highly elastic
4. Less Elastic Supply: The percentage change in the quantity supplied is smaller with a less elastic supply than the percentage change in price
5. Unitary Elastic Supply: If the percentage change in the quantity supplied is equal to the percentage change in price, such that the price elasticity of the supply is equal to one then the supply is said to be unitary elastic for such a commodity.
Time Period and Supply
In many situations, the shift in supply continues to vary when considered over different periods of time. This insight contributes to the division of time into three periods of time.
1. Market Period:
2. Short period:
3. Long period:
What is Profit?
Profit is the sum of earnings that exceed the expenditure for the period. In business and finance, profit is one of the most important terms. Net income is also called profit.
Fun Facts about the Supply Curve
Did you know that the supply curve can shift? There are two scenarios in which it is possible for the supply curve to shift and these scenarios are:
Direct Relationship with Supply
Factors such as the state of technology have a direct connection to supply. In other words, the shift in such variables and output takes place in the same direction.
Inverse Relationship with Supply
Factors such as the price of other items tend to be in an opposite relationship with a commodity's supply.
Important The Theory of The Firm Under Perfect Competition Related Links
Chapter-wise Links for Microeconomics Class 12 Notes
Related Study Materials Links for Class 12 Microeconomics
Along with this, students can also download additional study materials provided by Vedantu for Microeconomics Class 12–
Benefits of the Revision Notes on Vedantu
There are several benefits that students can experience if they download the revision notes pdf from Vedantu. Some of those benefits are:
24x7 academic support from the best educators in India
Scoring the best marks in their classes
Learning new topics with ease and mastering familiar topics
Access to hundreds of online classes
FAQs on Cbse Class 12 Micro Economics Notes Chapter 4
1. What are the key concepts to focus on while revising The Theory of the Firm Under Perfect Competition for Class 12 Economics?
When revising this chapter, concentrate on the features of perfect competition such as a large number of sellers, homogeneous products, firms as price takers, free entry and exit of firms, and perfect knowledge in the market. Review concepts like revenue curves (TR, AR, MR), profit maximisation (MR = MC), break-even and shutdown points, and the distinctions between the short-run and long-run supply curves of a firm.
2. How is the price determined under perfect competition according to Class 12 revision notes?
Under perfect competition, price is determined by the overall industry through the interaction of demand and supply. No single firm can influence the price; each firm is a price taker and must accept the equilibrium price set by the market. The firm's role is limited to deciding how much output to sell at that price.
3. What should a student understand about the firm’s equilibrium in the context of perfect competition?
The firm’s equilibrium is achieved at the level of output where marginal cost (MC) equals marginal revenue (MR), and MC is rising. This ensures profit maximisation or minimum loss. Students should focus on understanding this condition and how it is applied in both the short run and long run for perfectly competitive firms.
4. Can you list the main differences between the short-run and long-run supply curves for a firm in perfect competition?
- Short-run supply curve: The portion of the firm’s marginal cost (MC) curve that lies above the average variable cost (AVC). Firms can only adjust variable factors.
- Long-run supply curve: The portion of the long-run marginal cost (LRMC) curve that lies above the minimum point of the long-run average cost (LRAC). All production factors can be varied and there is free entry and exit.
5. How do cost changes or technological advancements affect a firm’s supply in perfect competition?
Technological advancements and cost changes directly impact the supply. If technology improves or costs fall, the firm's marginal cost decreases, so they can supply more at the same price, which shifts the supply curve to the right. Conversely, higher input costs reduce profitability and can decrease supply.
6. What does it mean when a firm is called a ‘price taker’ in perfect competition?
In a perfectly competitive market, a ‘price taker’ is a firm that cannot influence the market price of its product. The price is set by overall market demand and supply, and each firm must accept this price. If a firm tries to charge a higher price, it will lose all its customers.
7. Why is the price elasticity of supply always positive in perfect competition?
Price elasticity of supply is always positive in perfect competition because an increase in price leads to an increase in the quantity supplied (direct relationship). Suppliers are willing to supply more when prices rise and less when they fall.
8. How do the concepts of break-even and shutdown points help in revision?
- Break-even point: It is the output level where total revenue equals total cost (TR = TC), and the firm earns normal profit only.
- Shutdown point: The output level where the price equals minimum average variable cost (AVC). Below this, the firm cannot cover variable costs and must cease production in the short run.
9. What common misconceptions should students avoid when revising this chapter?
Students often mistakenly think that firms can set prices in perfect competition, but they are always price takers. Another misconception is that all firms always make profits—in the long run, firms can only earn normal profits due to free entry and exit. Lastly, confusing short-run and long-run supply curves is also common. Revise the definitions and graphical representations for clarity.
10. How can students connect the concept of perfect competition with real-life examples for better understanding?
Real-life examples of perfect competition are rare, but markets like agricultural products (e.g., wheat, rice) closely resemble it, as many sellers offer similar products with little price variation. Consider these examples to visualise the concepts of homogeneous products, price taking, and free market entry/exit in practice.