


Symmetry Exercise-wise Questions and Answers For Class 6 Maths - Free PDF Download
NCERT Solutions for Chapter 9 Class 6 Maths, "Symmetry," covers the following exercises:
Exercise 9.1: Line of Symmetry: This exercise introduces the concept of line symmetry, where students learn to identify lines of symmetry in various shapes. It helps them understand how shapes can be divided into two identical halves.
Exercise 9.2: Rotational Symmetry: Here, students explore rotational symmetry and learn how shapes can look the same after being rotated. This exercise reinforces the idea of symmetry in different orientations and helps students visualise symmetrical patterns.
Access NCERT Solutions for Class 6 Maths Chapter 9 Symmetry
Exercise 9.1
Figure it Out
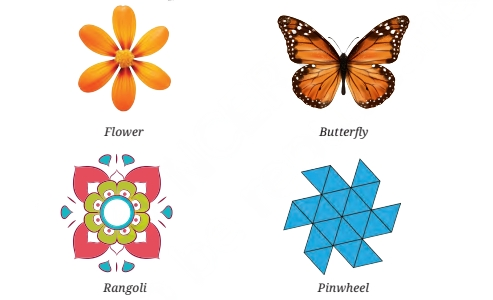
1. Do you see any line of symmetry in the figures at the start of the chapter? What about in the picture of the cloud?

Ans:
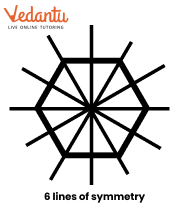
A flower exhibits 6 lines of symmetry. A butterfly has 1 line of symmetry. Rangoli patterns typically have 4 lines of symmetry. A pinwheel does not possess any lines of symmetry. A cloud's shape can vary, so it may or may not have a line of symmetry.
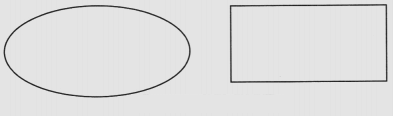
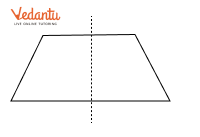
2. For each of the following figures, identify the line(s) of symmetry if it exists
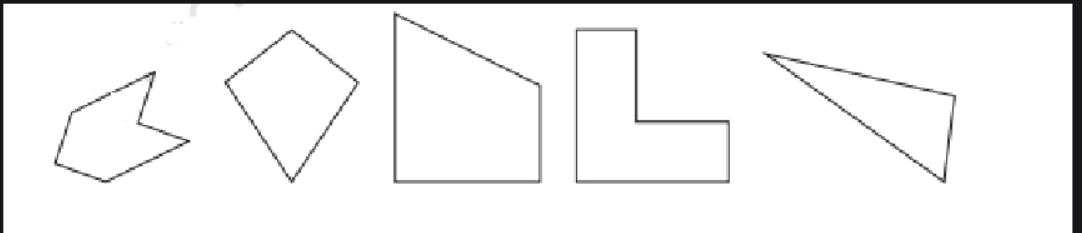
Ans:
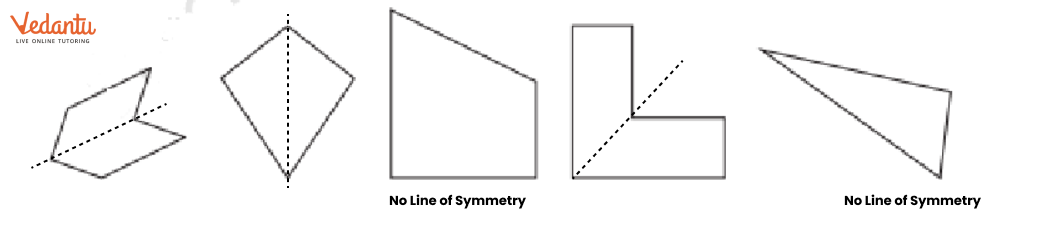
Figure is Out
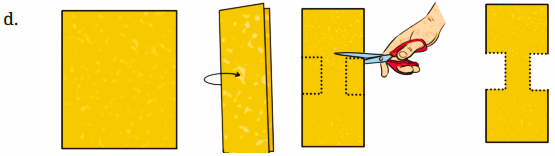
Punching Game:
The fold is a line of symmetry. Punch holes at different locations of a folded square sheet of paper using a punching machine and create different symmetric patterns.
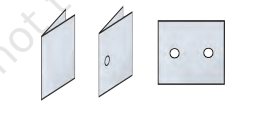
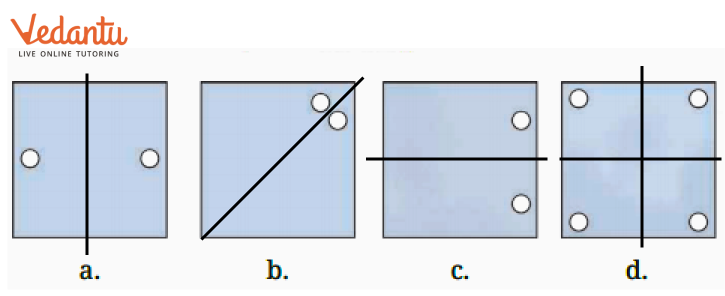
1. In each of the following figures, a hole was punched in a folded square sheet of paper and then the paper was unfolded. Identify the line along which the paper was folded.
Figure (d) was created by punching a single hole. How was the paper folded?
Ans:
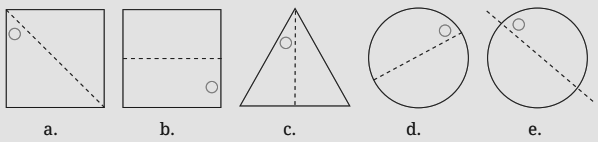
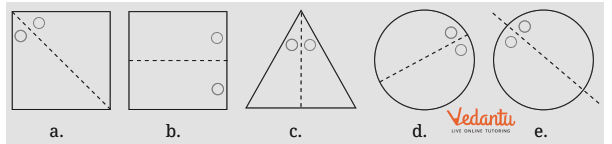
2. Given the line(s) of symmetry, find the other hole(s):
Ans:
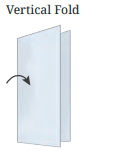
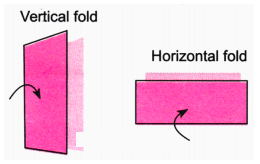
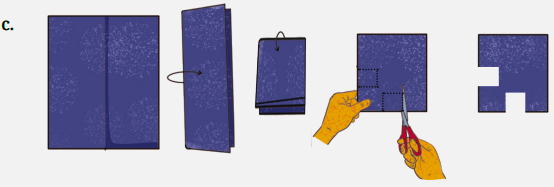
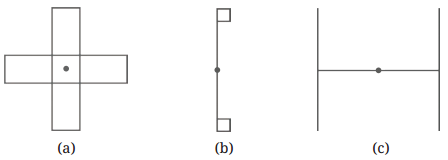
3. Here are some questions on paper cutting. Consider a vertical fold. We represent it this way:
Similarly, a horizontal fold is represented as follows:
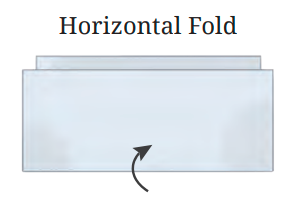
Ans:
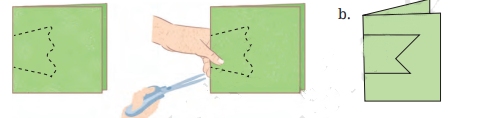
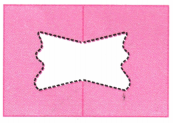
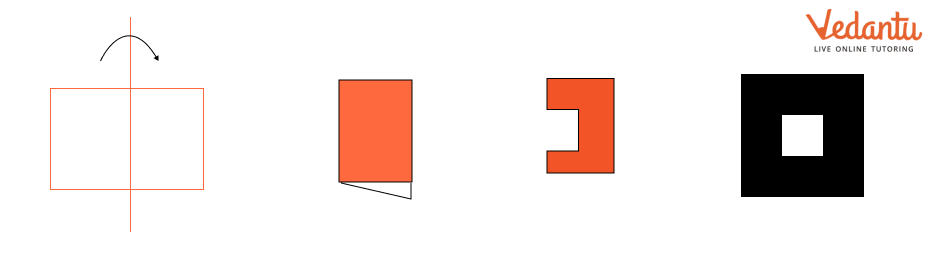
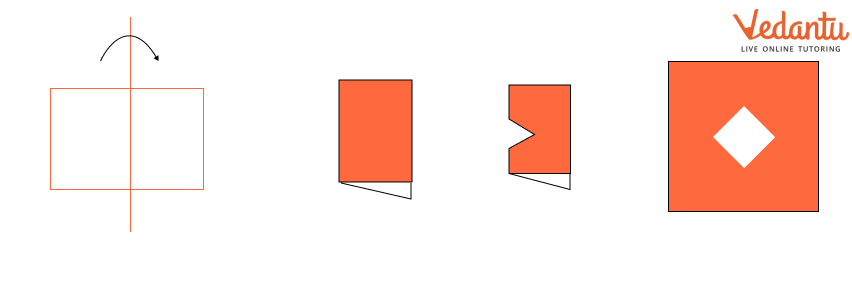
4. After each of the following cuts, predict the shape of the hole when the paper is opened. After you have made your prediction, make the cutouts and verify your answer.
Ans:
Ans:
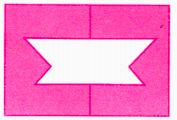
Ans:
Ans:
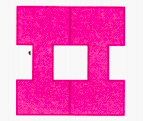
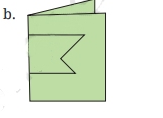
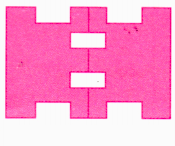
5. Suppose you have to get each of these shapes with some folds and a single straight cut. How will you do it?
a. The hole in the centre is a square.

Ans:
b. The hole in the centre is a square.

Ans:
Note: For the above two questions, check if the 4-sided figures in the centre satisfy both the properties of a square.
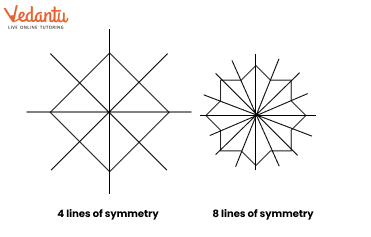
6. How many lines of symmetry do these shapes have?
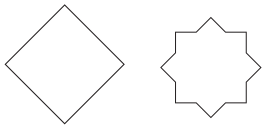
Ans:
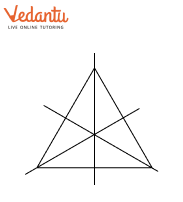
b. A triangle with equal sides and equal angles.
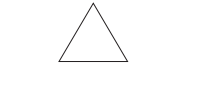
Ans:
c. A hexagon with equal sides and equal angles.
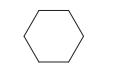
Ans:
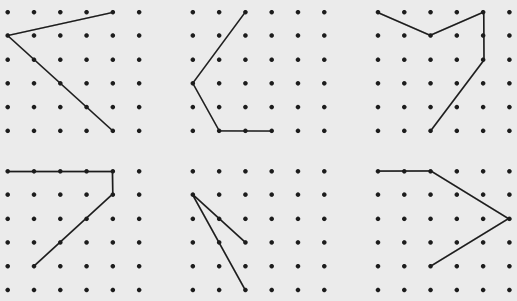
7. Trace each figure and draw the lines of symmetry, if any:
Ans:
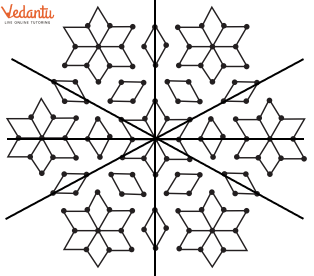
8. Find the lines of symmetry for the kolam below.
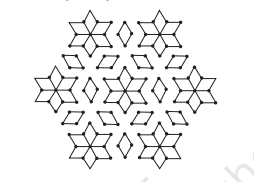
Ans:
9. Draw the following.
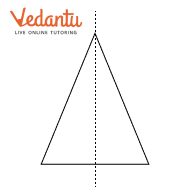
a. A triangle with exactly one line of symmetry.
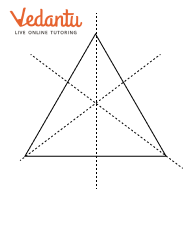
b. A triangle with exactly three lines of symmetry.
c. A triangle with no line of symmetry.
Is it possible to draw a triangle with exactly two lines of symmetry?
Ans:
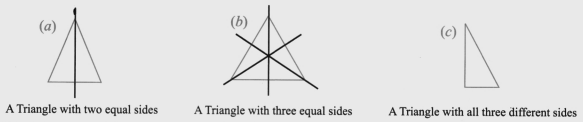
No, it is not possible to create a triangle that has exactly two lines of symmetry.
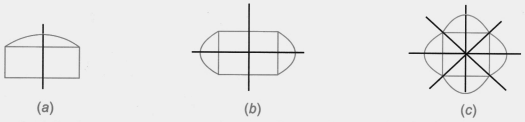
10. Draw the following. In each case, the figure should contain at least one curved boundary.
a. A figure with exactly one line of symmetry.
b. A figure with exactly two lines of symmetry.
c. A figure with exactly four lines of symmetry.
Ans:
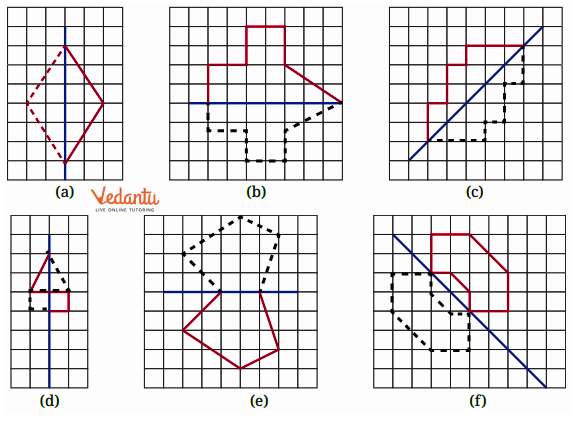
11. Copy the following on squared paper. Complete them so that the blue line is a line of symmetry. Problem (a) has been done for you.
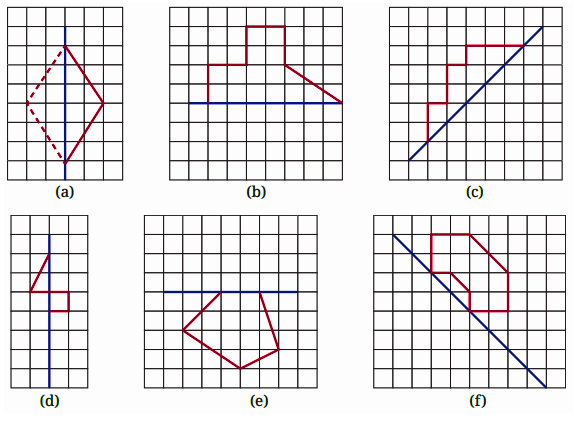
Hint: For (c) and (f), see if rotating the book helps!
Ans:
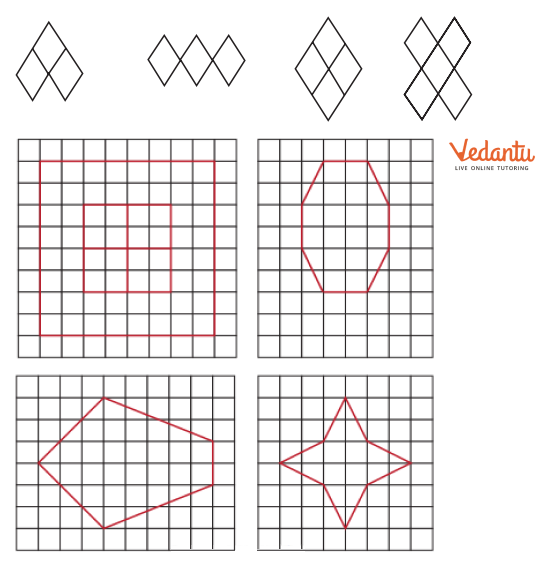
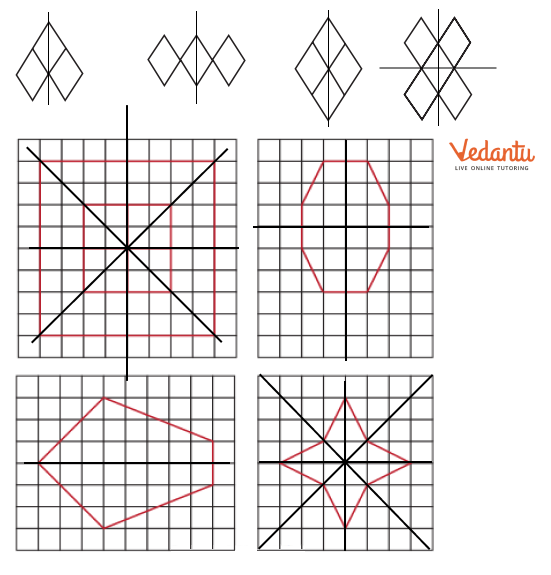
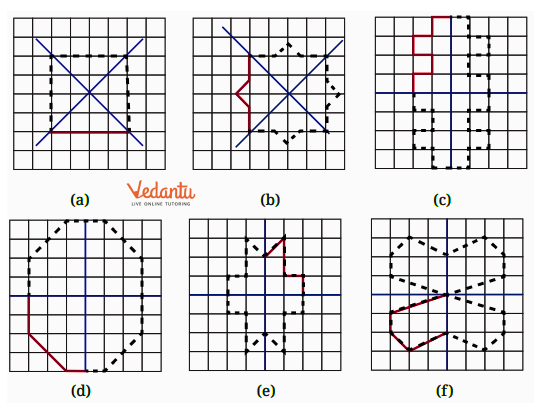
12. Copy the following drawing on squared paper. Complete each one of them so that the resulting figure has the two blue lines as lines of symmetry.
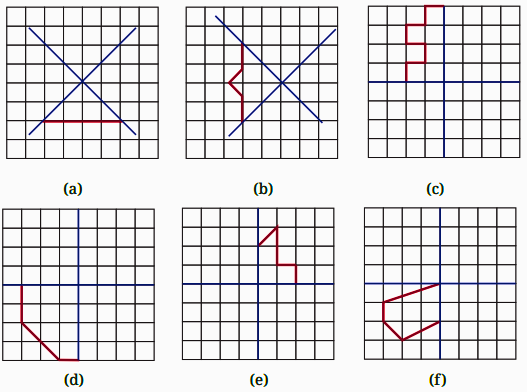
Ans:
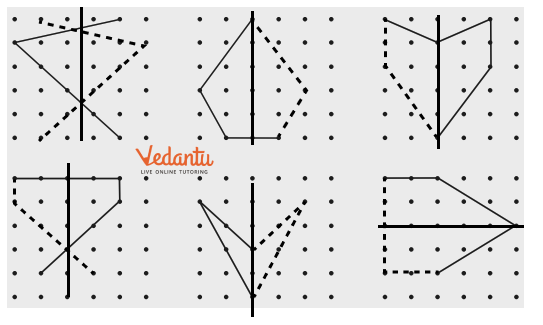
13. Copy the following on a dot grid. For each figure draw two more lines to make a shape that has a line of symmetry.
Ans:
Exercise 9.2
Figure it Out
1. Find the angles of symmetry for 2. Which of the following figures have more than one angle of symmetry? the given figures about the point marked •.
Ans: To determine the angle of symmetry, let’s rotate the figure by 90°.
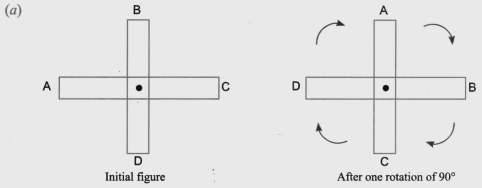
After a 90° rotation, the figure remains unchanged, indicating that 90° is the angle of symmetry.
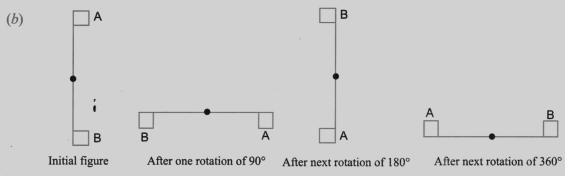
A 90° rotation results in a new figure that does not overlap with the original. The figure returns to its original shape only after completing a full 360° rotation, meaning 360° is also an angle of symmetry.
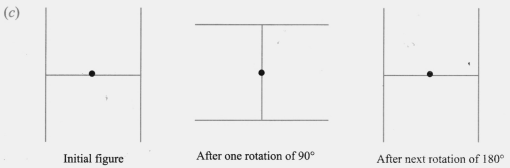
The figure remains unchanged after a 180° rotation, which confirms that 180° is another angle of symmetry.
2. Which of the following figures have more than one angle of symmetry?
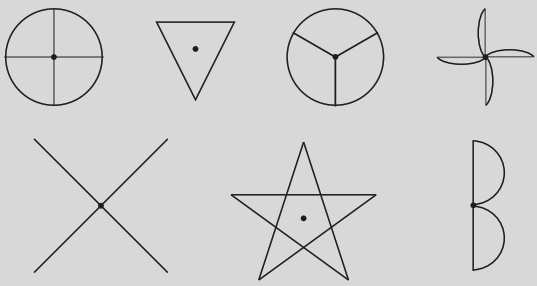
Ans: All options except (g) have multiple angles of symmetry. This indicates that those figures possess various ways to rotate and maintain their original appearance.
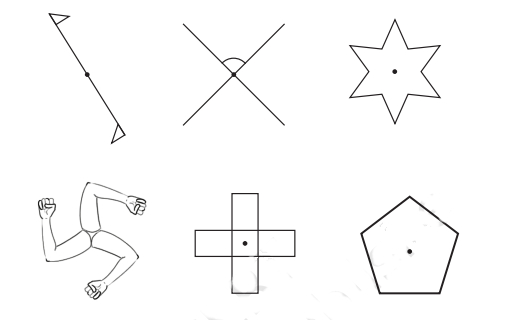
3. Give the order of rotational symmetry for each figure:
Ans:
(a) 2
(b) 1
(c) 6
(d) 3
(e) 4
(f) 5
Figure it Out
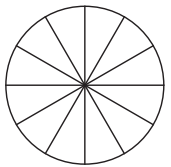
1. Colour the sectors of the circle below so that the figure has
i) 3 angles of symmetry,
ii) 4 angles of symmetry,
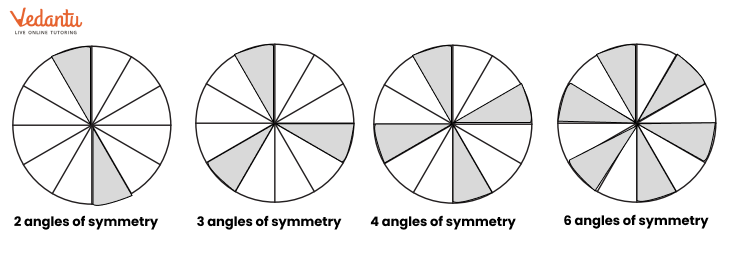
iii) what are the possible numbers of angles of symmetry you can obtain by colouring the sectors in different ways?
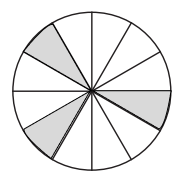
Ans: (a) It will appear the same after each 120° rotation.
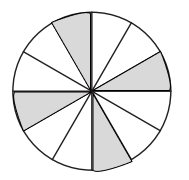
(b) It will look the same after every 90° rotation.
(c) There are four possible ways.
2. Draw two figures other than a circle and a square that have both reflection symmetry and rotational symmetry.
Ans:
3. Draw, wherever possible, a rough sketch of:
a. A triangle with at least two lines of symmetry and at least two angles of symmetry.
Ans:
b. A triangle with only one line of symmetry but not having rotational symmetry.
Ans:
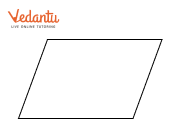
c. A quadrilateral with rotational symmetry but no reflection symmetry.
Ans:
d. A quadrilateral with reflection symmetry but not having rotational symmetry.
Ans:
4. In a figure, 60° is the smallest angle of symmetry. What are the other angles of symmetry of this figure?
Ans: Since 60° is the smallest angle, any angle that is a multiple of 60° up to 360° is also an angle of symmetry. The angles include 120°, 180°, 240°, 300°, and 360°. This means the figure can maintain its symmetry at these specific rotational angles.
5. In a figure, 60° is an angle of symmetry. The figure has two angles of symmetry less than 60°. What is its smallest angle of symmetry?
Ans: The smallest angle of symmetry is calculated as 60° divided by 3, which equals 20°.
6. Can we have a figure with rotational symmetry whose smallest angle of symmetry is:
a. 45°?
Ans: Yes, because 360 is divisible by 45.
b. 17°?
Ans: No, because 360 is not divisible by 17.
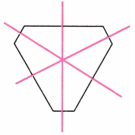
7. This is a picture of the new Parliament Building in Delhi.
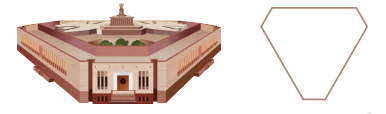
a. Does the outer boundary of the picture have reflection symmetry? If so, draw the lines of symmetries. How many are they?
Ans: The outer boundary exhibits rotational symmetry around its centre.
The smallest angle of rotation is calculated as 360° ÷ 3 = 120°.
Additional angles of rotation are 240° and 360°.
b. Does it have rotational symmetry around its centre? If so, find the angles of rotational symmetry.
Ans: The outer boundary displays reflection symmetry, featuring 3 lines of symmetry.
8. How many lines of symmetry do the shapes in the first shape sequence in Chapter 1, Table 3, the Regular Polygons, have? What number sequence do you get?
Ans:
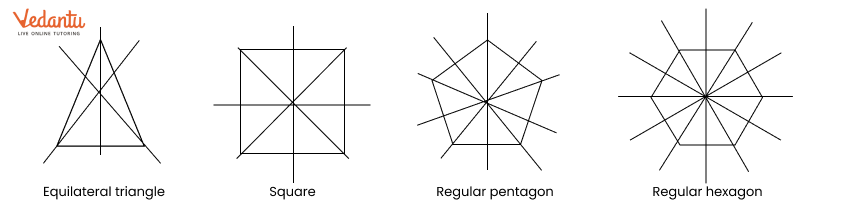
A 3-sided regular polygon (equilateral triangle) has 3 lines of symmetry.
A 4-sided regular polygon (square) has 4 lines of symmetry.
A 5-sided regular polygon (regular pentagon) has 5 lines of symmetry.
A 6-sided regular polygon (regular hexagon) has 6 lines of symmetry.
We can see a clear pattern: the number of sides in a regular polygon equals the number of lines of symmetry. The number sequence is: 3, 4, 5, 6, 7, …
9. How many angles of symmetry do the shapes in the first shape sequence in Chapter 1, Table 3, the Regular Polygons, have? What number sequence do you get?
Ans: The number of angles of symmetry is equal to the number of lines of symmetry. Therefore, we have the following number sequence: 3, 4, 5, 6, 7, …
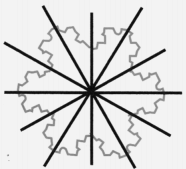
10. How many lines of symmetry do the shapes in the last shape sequence in Chapter 1, Table 3, the Koch Snowflake sequence, have? How many angles of symmetry?
Ans:
11. How many lines of symmetry and angles of symmetry does Ashoka Chakra have?

Ans: The Ashoka Chakra features 24 spokes that are evenly distributed. These 24 spokes form 12 pairs. A line drawn through each opposite pair represents a line of symmetry, resulting in a total of 12 lines of symmetry. The smallest angle of symmetry is calculated as 360° ÷ 12 = 30°. The other angles of symmetry are multiples of this angle up to 360°. These include 60°, 120°, 150°, and so on, totaling 12 angles.
Benefits of NCERT Solutions for Class 6 Maths Chapter 9 Symmetry
Provides easy-to-follow explanations about symmetry, helping students understand concepts like line symmetry and rotational symmetry clearly.
Offers clear steps and methods for identifying symmetrical shapes, making it simpler for students to learn and apply these concepts effectively.
Helps students learn the basics of symmetry, which is essential for understanding more advanced topics in geometry.
Includes various practice problems that improve students' ability to recognise and work with symmetrical patterns, enhancing their problem-solving skills.
The FREE PDF download allows students to study and practice at their own pace, making learning more convenient and flexible.
Class 6 Maths Chapter 9: Exercises Breakdown
Important Study Material Links for Class 6 Maths Chapter 9 - Symmetry
Conclusion
NCERT Solutions for Class 6 Maths Chapter 9, "Symmetry," helps students understand how to identify and work with symmetrical shapes, including concepts like line and rotational symmetry. The clear explanations make it easier to learn these important ideas and their applications in real life. Practising the exercises enhances student’s skills in recognizing symmetry, which is essential for more advanced geometry topics. With the solutions available as a FREE PDF download, students can study and review at their own pace, making learning both convenient and effective.
Chapter-wise NCERT Solutions Class 6 Maths
The chapter-wise NCERT Solutions for Class 6 Maths are given below. Go through these chapter-wise solutions to be thoroughly familiar with the concepts.
Related Important Links for Maths Class 6
Along with this, students can also download additional study materials provided by Vedantu for Maths Class 6.

FAQs on NCERT Solutions For Class 6 Maths Chapter 9 Symmetry - 2026-27
1. What is the main concept covered in NCERT Solutions for Class 6 Maths Chapter 9, Symmetry?
Symmetry primarily covers the identification of lines of symmetry and rotational symmetry in various shapes and patterns. Students learn to recognize symmetrical figures and understand how objects can be divided or rotated to form mirror images or repeating patterns, as per CBSE 2026–27 guidelines.
2. How should students approach solving line symmetry questions in Class 6 Maths Chapter 9?
To solve line symmetry questions, students should:
- Identify possible axes that could divide the figure into two equal halves.
- Use tracing or folding techniques to check for mirror images.
- Mark and count the valid lines of symmetry on each shape, following the stepwise method used in the official NCERT Solutions.
3. What is rotational symmetry, and how can it be identified in Class 6 Maths Chapter 9?
Rotational symmetry occurs when a shape looks the same after being rotated around a point by a certain angle, less than 360°. In Exercise 9.2, students analyze figures for positions where they match their original appearance after rotation and note the smallest angle of symmetry that works.
4. What steps should be followed to solve problems involving both line and rotational symmetry?
To address shapes with both line and rotational symmetry:
- First, check and mark all possible lines of symmetry by folding or drawing.
- Next, rotate the figure in increments (like 90°, 120°, 180°) to see if the shape aligns with its starting position before completing a full circle.
- Record the order of rotational symmetry and compare with the number of lines of symmetry.
5. Why is understanding symmetry important for higher-level geometry, based on NCERT Solutions for Class 6 Maths Chapter 9?
Learning symmetry concepts builds essential visual-spatial skills. It forms the basis for advanced topics such as transformations, geometric constructions, and pattern recognition. Mastery here helps students in later classes where they study congruence, similarity, and tessellations.
6. What common mistakes do students make in Class 6 Maths Chapter 9 on symmetry, and how can they avoid them?
Common errors include:
- Miscounting lines of symmetry by overlooking axes due to carelessness.
- Mistaking partial symmetry (like in an irregular figure) for full symmetry.
- Ignoring the center point in rotational symmetry or rotating by wrong angles.
7. How do the NCERT Solutions for Chapter 9 help students handle real-life applications of symmetry?
The solutions link symmetry to real-world examples such as architecture, art, and nature. They encourage students to look for symmetry in daily life, building observation and analysis skills valuable for higher studies and creative fields.
8. What is the method for finding the number of lines of symmetry in regular polygons as taught in Chapter 9?
In regular polygons, the number of lines of symmetry equals the number of sides. For example, a regular pentagon has 5 lines of symmetry. Draw lines passing through each vertex and the midpoint of the opposite side to visualize all axes.
9. How can students verify if their answer for the smallest angle of rotational symmetry is correct?
Divide 360° by the order of rotational symmetry. For example, if a figure has 4-fold rotational symmetry, 360° ÷ 4 = 90°. Check if rotating the shape by this angle aligns it with its original position. Use this approach to confirm all calculations as given in the NCERT Solutions.
10. How do symmetry problems in Chapter 9 connect with patterns found in nature, as per the NCERT Solutions?
Natural elements like flowers, leaves, snowflakes, and certain animals exhibit symmetry. Chapter 9 NCERT Solutions include examples demonstrating how these patterns follow symmetry rules, enhancing the student's ability to link mathematics with the natural world.
11. What strategies can students use if they face difficulty in solving symmetry questions from Class 6 Maths Chapter 9?
If a problem seems tough, students are advised to:
- Review stepwise solutions in the NCERT Solutions thoroughly.
- Practice tracing and folding exercises to visualize symmetry.
- Seek help from visual aids or online explanations maintained as per CBSE 2026–27 syllabus.
12. What ‘what if’ scenarios are addressed in the NCERT Solutions for Chapter 9 to deepen conceptual understanding?
NCERT Solutions include—
- What if a figure has no symmetry? Students learn to distinguish between asymmetric and symmetric figures.
- What if lines of symmetry overlap? It counts as one line, reinforcing the concept of uniqueness.
- What if a figure seems to have two lines but they do not divide it into mirror images? Such lines are not valid axes.
13. How can students use the NCERT Solutions for effective homework and exam preparation in Chapter 9?
The NCERT Solutions give stepwise, CBSE-style answers to all textbook problems, making it easy to reference correct methods. By following these systematically, students improve their accuracy and train for the kind of questions asked in exams.