


Principle theory and applications of UV Visible Spectroscopy
In Chemistry, as we deal with various compounds, the most common (as well as obvious) way we distinguish various compounds is by colour. The compounds with discernible colours reflect the light of a certain wavelength that our eyes capture. The light our eyes can capture represents a small width in the electromagnetic spectrum, which falls between 400-800 nm- this is called the visible spectrum. The lower wavelength band from 100-400nm represents the UV (ultraviolet) spectrum. Let us read ahead to know more about UV visible spectroscopy and its uses.
What is UV Visible Spectroscopy?
UV-visible spectroscopy is a technique that measures the amount of light absorbed by a chemical substance. It is absorption spectroscopy or reflectance spectroscopy technique within the ultraviolet and visible regions of the electromagnetic spectrum. When continuous radiation is passed through a compound a portion of that compound is absorbed by the compound. The residual radiation after passing through the compound yields a spectrum with gaps in it due to absorption by the compound, this spectrum is called the absorption spectrum.
Absorption of UV-Visible radiation results in the electronic transition of the compound, i.e., an electron in the ground state (occupied orbital) is promoted to the excited state (unoccupied orbital), and the amount of radiation absorbed corresponds to the energy difference between the ground state and the excited state.
UV Visible Spectroscopy Principle
UV-visible spectroscopy is a quantitative technique used in analytical chemistry to measure the amount of light absorbed by a substance. When light falls upon a substance it absorbs and reflects a certain amount of radiation. As the light passes through the sample, the amount of radiation absorbed by the substance is the difference between the incident radiation (Io) and the transmitted radiation (I). The amount of radiation absorbed is called absorbance (A) and transmittance (T), which is a fraction (I/ Io) indicating the amount of light that has passed through the sample.
Transmittance, T = I/ Io
Absorbance, A = log10(Io /I) = log10 (1/T) = - log10 (T)
According to Beer-Lambert’s Law, the absorbance of a solution (containing the compound) is directly proportional to the concentration of the absorbing species (the compound) and the path length. This translates to, as the number of molecules (concentration) capable of absorbing the radiation at a given wavelength increases, the extent of absorption is increased. Also, the efficiency of the molecule (recorded by its molar absorptivity) in absorbing the radiation contributes to greater absorption.
The formulation for Beer-Lambert’s law is given by
A= εcl
for a given wavelength
Where ε = molar absorptivity (also known as molar extinction coefficient)
c = molar concentration of the absorber (solute)
l = path length (length of the sample cell or cuvette; in cm)
The mathematical relation between absorbance and concentration established by the Beer-Lambert law allows direct measurement of the concentration of the absorber in a solution from absorbance for a fixed path length.
Instrumentation of UV Visible Spectroscopy
The instrumentation of UV-Visible spectroscopy is called a UV-Visible spectrophotometer. The spectrophotometer has a few key components, namely:
The light source emits broadband electromagnetic radiation across the UV-visible spectrum.
The dispersion device or monochromator - it’s a diffraction grating that separates the radiation into its component wavelength.
A sample area - the radiation interacts with the sample as it passes through or reflects off.
Detector - measures the reflected or transmitted radiation intensity.
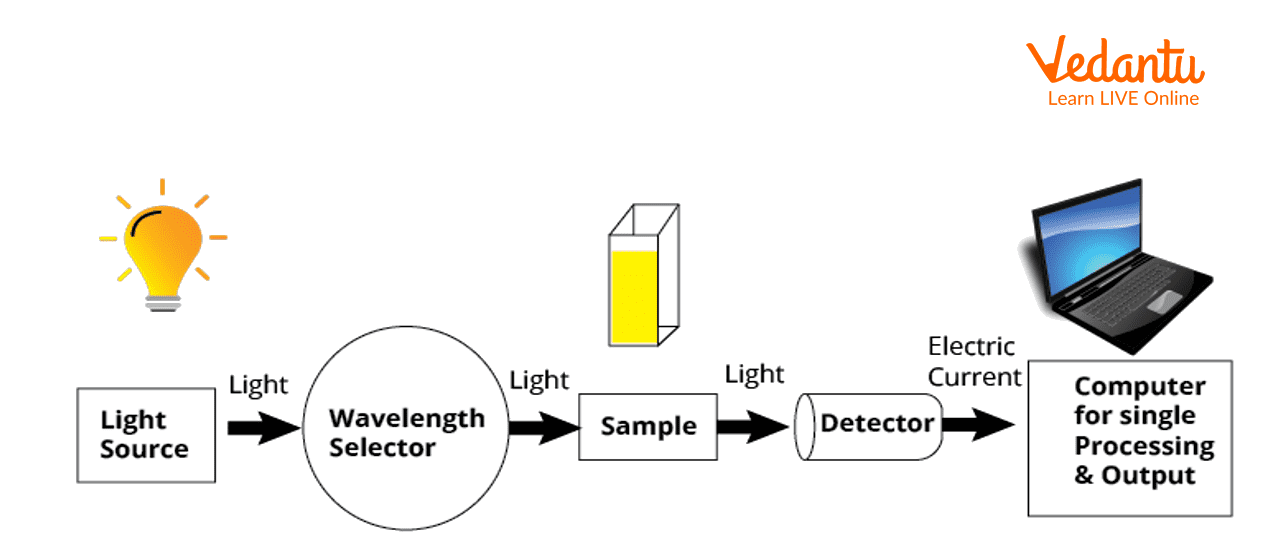
Representation of Working of the UV-Vis Spectrophotometry
The measurement is done by placing the sample in the sample compartment. Liquid samples are held in a rectangular holder made of glass, quartz or plastic, called a cuvette. Standard cuvettes have a 10mm path length and allow easy transmittance of ultraviolet radiation. The sample is placed in the path of the radiation as the beam from the monochromator passes through the sample to the detector.
The spectrophotometer compares the light intensity of the incident radiation (Io) before passing through the sample and the intensity of the transmitted radiation (I) that has passed through the sample and presents the absorbance value (A or Abs).
Application of UV Visible Spectroscopy
UV-Visible spectroscopy is widely used to determine the chemical and physical properties of substances. It can be used for:
Identification of molecules in a sample.
Determining the concentration of a compound in a sample.
Determine the purity or concentration of biological samples containing DNA or RNA.
It finds application in characterising the rate of a chemical reaction.
Advantages and Disadvantages of UV Visible Spectroscopy
Advantages
The method is non-destructive so that the sample can be reused.
The technique is fairly simple and can be used easily. No prior training is necessary.
Measurement can be done in a short span of time, helping easy integration into experiments.
Data analysis is simple and requires less processing.
Instrumentation is relatively inexpensive and can be procured easily by laboratories.
Disadvantages
Real instruments are not always perfect; hence stray light may interfere with the measurements.
Scattering of light due to bubbles or undissolved solid particles in the sample solution causes measurement error.
Beer-Lambert Law is only obeyed when a single absorbing species is present in the solution. A sample containing multiple absorbing species cannot be used to determine concentration using absorbance.
Improper orientation of the sample holder or misalignment can imbibe errors in the measurement.
Interesting Facts
Part of a molecule (usually an organic compound) that absorbs in the visible region gives colour to the compound and is called a chromophore.
Organic compounds with a high degree of conjugation absorb in the UV-Visible region.
Microspectrophotometry is the UV-visible spectroscopy of microscopic samples, where an optical microscope is fitted with UV-Visible optics.
Key Features
UV-Visible Spectroscopy is absorption spectroscopy.
In UV-Visible spectroscopy, compounds absorb light falling in the UV-Visible range of the electromagnetic spectrum.
UV-Visible Spectroscopy is measured by an instrument called UV-Visible Spectrophotometer.
The UV-Visible Spectrophotometer measures absorbance.
Beer-Lambert Law relates the concentration of the absorber with the absorbance of the solution.
FAQs on UV Visible Spectroscopy in Analytical Chemistry
1. What is UV-Visible spectroscopy?
UV-Visible spectroscopy is an analytical technique that measures the absorption of ultraviolet (200–400 nm) and visible (400–700 nm) light by a substance to determine its concentration and electronic structure. It is based on the absorption of light that promotes electrons from lower to higher energy levels.
In UV-Vis spectroscopy:
- Molecules absorb light causing electronic transitions (e.g., π → π* and n → π*).
- The amount of absorbed light is measured as absorbance.
- It is widely used for quantitative analysis using the Beer–Lambert law.
This technique is commonly used in analytical chemistry, biochemistry, and pharmaceutical analysis.
2. What is the Beer–Lambert law in UV-Visible spectroscopy?
Beer–Lambert law states that absorbance is directly proportional to concentration and path length, expressed as A = εlc. Here, A is absorbance, ε is molar absorptivity (L mol-1 cm-1), l is path length (cm), and c is concentration (mol L-1).
Key points:
- If concentration increases, absorbance increases linearly (for dilute solutions).
- A plot of absorbance vs concentration gives a straight line.
- Used for determining unknown concentrations in solution.
This law forms the basis of quantitative analysis in UV-Visible spectroscopy.
3. How does UV-Visible spectroscopy work?
UV-Visible spectroscopy works by passing UV or visible light through a sample and measuring the amount of light absorbed at specific wavelengths.
The working steps are:
- A light source emits UV or visible radiation.
- A monochromator selects a specific wavelength.
- The light passes through the sample in a cuvette.
- A detector measures transmitted light and calculates absorbance.
Absorption occurs when photon energy matches the energy difference between molecular electronic levels.
4. What are the types of electronic transitions in UV-Vis spectroscopy?
Electronic transitions in UV-Vis spectroscopy involve promotion of electrons from bonding or non-bonding orbitals to antibonding orbitals.
The main types are:
- σ → σ* (high energy, usually in vacuum UV region)
- n → σ* (seen in alcohols, amines)
- π → π* (common in alkenes and aromatic compounds)
- n → π* (seen in carbonyl compounds)
Among these, π → π* transitions are commonly observed in conjugated organic molecules.
5. What is λmax in UV-Visible spectroscopy?
λmax is the wavelength at which a substance shows maximum absorbance in its UV-Vis spectrum.
Important points:
- Each compound has a characteristic λmax.
- It is used for qualitative identification of compounds.
- Quantitative measurements are usually performed at λmax for highest sensitivity.
For example, many aromatic compounds absorb strongly near 254 nm due to π → π* transitions.
6. What is the difference between absorbance and transmittance?
Absorbance (A) measures how much light is absorbed, while transmittance (T) measures the fraction of light that passes through a sample.
Their relationship is:
- T = I / I0
- A = −log T = log(I0/I)
Where I0 is incident light intensity and I is transmitted intensity. As absorbance increases, transmittance decreases.
7. Why do conjugated compounds absorb at longer wavelengths?
Conjugated compounds absorb at longer wavelengths because conjugation lowers the energy gap between HOMO and LUMO orbitals.
Key explanation:
- Extended π-electron delocalization stabilizes molecular orbitals.
- The energy required for π → π* transition decreases.
- Lower energy corresponds to longer wavelength (E = hc/λ).
As conjugation increases, a bathochromic shift (red shift) is observed in the UV-Vis spectrum.
8. What is a chromophore in UV-Visible spectroscopy?
A chromophore is the part of a molecule responsible for absorbing UV or visible light due to the presence of π or non-bonding electrons.
Common chromophores include:
- C=C (alkenes)
- C=O (carbonyl group)
- –NO2 (nitro group)
- Aromatic rings
Chromophores undergo electronic transitions such as π → π* or n → π*, producing characteristic absorption bands.
9. How do you calculate concentration using UV-Vis spectroscopy?
Concentration is calculated using the Beer–Lambert law formula A = εlc by rearranging it to c = A/(εl).
Steps:
- Measure absorbance (A) at λmax.
- Use known molar absorptivity (ε).
- Use cuvette path length (usually 1 cm).
- Substitute into c = A/(εl).
Example: If A = 0.50, ε = 100 L mol-1 cm-1, and l = 1 cm, then c = 0.50/(100 × 1) = 0.005 mol L-1.
10. What are the applications of UV-Visible spectroscopy?
UV-Visible spectroscopy is used for quantitative analysis, compound identification, and studying electronic structure.
Major applications include:
- Determination of concentration using Beer–Lambert law.
- Analysis of pharmaceuticals and drugs.
- Monitoring reaction kinetics.
- Protein and DNA analysis in biochemistry.
- Detection of metal ions through complex formation.
It is one of the most widely used analytical techniques in chemistry laboratories.