


Class 12 Geography Chapter 2 The World Population Distribution, Density and Growth Important Questions with Answers PDF
These 20 solved questions cover population density calculations, migration, birth and death rates, demographic transition and the factors influencing population distribution. Students can practise five MCQs, four very short answers, five short answers and six long answers based on the NCERT chapter.
Class 12 Geography Chapter 2 MCQs with Answers
Q1. Which statement correctly explains the uneven distribution of the world's population, as described in the NCERT chapter?
(a) About 50% of people occupy 50% of the land area.
(b) About 90% of people live on approximately 10% of the land area.
(c) Most people live in polar and desert regions.
(d) All continents have nearly equal population densities.
Answer: (b) About 90% of people live on approximately 10% of the land area.
Explanation: The textbook uses this approximate distribution to show that people are highly concentrated in certain parts of the world. The figure is a textbook illustration of population concentration, not a current population estimate.
Q2. A region has 2,40,000 people living in an area of 160 sq km. What is its population density?
(a) 150 persons per sq km
(b) 1,500 persons per sq km
(c) 2,400 persons per sq km
(d) 15,000 persons per sq km
Answer: (b) 1,500 persons per sq km
Solution:
$$\begin{aligned} \text{Population Density} &= \dfrac{\text{Total Population}}{\text{Total Area}} \\[8pt] &= \dfrac{2,40,000}{160} \\[8pt] &= 1,500 \end{aligned}$$
Therefore, the population density is 1,500 persons per sq km.
Q3. Which of the following is a pull factor of migration?
(a) Unemployment
(b) Epidemics
(c) Political unrest
(d) Better educational and medical facilities
Answer: (d) Better educational and medical facilities
Explanation: Pull factors make a destination attractive. Better schools, hospitals, employment opportunities and living conditions encourage people to move to a particular place.
Q4. Why does population increase rapidly during the second stage of demographic transition?
(a) Birth and death rates are both very high.
(b) The death rate falls while the birth rate remains relatively high.
(c) Birth and death rates are both very low.
(d) Migration completely stops.
Answer: (b) The death rate falls while the birth rate remains relatively high.
Explanation: Improvements in sanitation, food supply and healthcare reduce mortality. Birth rates initially remain high, creating a large gap between births and deaths and causing rapid natural population growth.
Q5. Which pair of locations is correctly matched with a factor influencing population distribution?
(a) Ganga plains – Extremely cold climate
(b) Kobe–Osaka region – Industrialisation
(c) Himalayan mountains – Extensive flat agricultural land
(d) Mediterranean region – Severe polar conditions
Answer: (b) Kobe–Osaka region – Industrialisation
Explanation: The NCERT textbook identifies the Kobe–Osaka region of Japan as an example of population concentration associated with industries and employment opportunities.
Class 12 Geography Chapter 2 Very Short Answer Questions
Q6. What is population distribution? How is it different from population density?
Answer: Population distribution refers to how people are spread across the Earth's surface.
Population density measures the number of people living per unit of land area, usually expressed as persons per square kilometre.
Difference: Distribution describes where people live, whereas density describes how many people live in a given area.
Q7. Name the three components of population change.
Answer: The three components are:
Births: Add people to the population.
Deaths: Reduce population size.
Migration: Changes population as people enter or leave an area.
These components determine whether a region's population grows or declines.
Q8. Differentiate between immigration and emigration with one example.
Answer: Immigration means moving into a place, while emigration means moving out of a place.
For example, a person moving from Country A to Country B is an emigrant from Country A and an immigrant in Country B.
Q9. What is the difference between natural growth and actual population growth?
Answer:
Natural growth is the difference between births and deaths.
NaturalGrowth=Births - Deaths
Actual growth also considers migration.
ActualGrowth=Births - Deaths + In-migration - Out-migration
A region can therefore grow through migration even when its natural increase is low.
Class 12 Geography Chapter 2 Short Answer Questions
Q10. Explain how water availability, landforms, climate and soils influence population distribution.
Answer: Physical conditions strongly influence where people settle.
Examples: The Ganga plains have high population concentrations because of favourable landforms, water availability and agricultural conditions. In contrast, difficult terrain limits settlement in many Himalayan mountain areas.
Q11. A town records 4,500 live births, 2,700 deaths, 1,200 people moving in and 900 people moving out during a year. Calculate its natural growth and actual population growth.
Answer:
Step 1: Calculate natural growth.
NaturalGrowth=4,500-2,700
= 1,800 People
Step 2: Calculate actual growth.
ActualGrowth=4,500-2,700+1,200-900
= 2,100 People
Step 3: Interpret the result.
The town gained 1,800 people through natural increase and another 300 through net in-migration.
Therefore, its total population increased by 2,100 people during the year.
Q12. Differentiate between crude birth rate (CBR) and crude death rate (CDR). Write their formulas.
Answer:
Crude Birth Rate:
$\begin{aligned}CBR &= \dfrac{B}{P} \times 1,000 \\[12pt]\end{aligned}$
Crude Death Rate:
$\begin{aligned}CDR &= \dfrac{D}{P} \times 1,000\end{aligned}$
Here:
B = Number of live births during the year
D = Number of deaths during the year
P = Estimated mid-year population
These measures help geographers understand population change and compare demographic conditions across regions.
Q13. Distinguish between push and pull factors of migration with examples.
Answer:
Example: A person may leave a village because employment opportunities are limited and move to a city offering jobs and educational facilities.
Unemployment is the push factor, while better opportunities in the city are pull factors.
Q14. Explain why mining areas, industrial regions and cities often attract large populations. Give NCERT examples.
Answer: Economic activities influence population concentration because they create jobs and support the development of services.
1. Mineral Resources
Mineral deposits encourage mining and related industries. These activities attract workers and other service providers.
NCERT example: The Katanga–Zambia copper belt in Africa.
2. Industrialisation
Industrial regions create employment in factories, transport, banking, trade, healthcare and education.
NCERT example: The Kobe–Osaka industrial region of Japan.
3. Urbanisation
Cities attract people through employment opportunities, schools, hospitals, transport facilities and other services.
Conclusion: Economic opportunities can increase population concentration even in areas where physical conditions alone do not explain dense settlement.
Class 12 Geography Chapter 2 Long Answer Questions
Q15. Discuss the major factors influencing the distribution and density of population in the world.
Answer: World population is distributed unevenly because different places offer different living conditions, resources and opportunities. The NCERT chapter groups these influences into geographical, economic, and social and cultural factors.
Part A: Geographical Factors
1. Availability of Water
Water is essential for drinking, agriculture, livestock and industries. River valleys and places with reliable freshwater supplies generally attract more settlements.
2. Landforms
Flat plains and gentle slopes are suitable for cultivation, roads, industries and housing. Mountainous regions often face transport and construction difficulties.
3. Climate
Areas with moderate temperatures and favourable rainfall generally support more settlements than extremely hot, cold or wet regions.
4. Soils
Fertile soils support agricultural production and encourage settlement, particularly in farming regions.
Part B: Economic Factors
1. Minerals: Mining regions attract workers and industries. The Katanga–Zambia copper belt is an example given in NCERT.
2. Urbanisation: Cities attract migrants through employment, education, healthcare and better infrastructure.
3. Industrialisation: Industrial centres provide jobs in factories and related services. The Kobe–Osaka region is an important example.
Part C: Social and Cultural Factors
Religious and cultural significance can attract people to particular places. Political unrest and poor social conditions may cause people to move away.
Governments may also encourage settlement in sparsely populated areas through incentives.
Conclusion: Population distribution results from the combined influence of natural conditions, economic opportunities and social circumstances.
Q16. Explain the three stages of demographic transition theory with a suitable diagram.
Answer: Demographic transition theory explains how birth rates, death rates and population growth change as societies develop.
The NCERT chapter presents a three-stage model that traces the transition from rural, agrarian societies to urban, industrial societies.
Three Stages of Demographic Transition
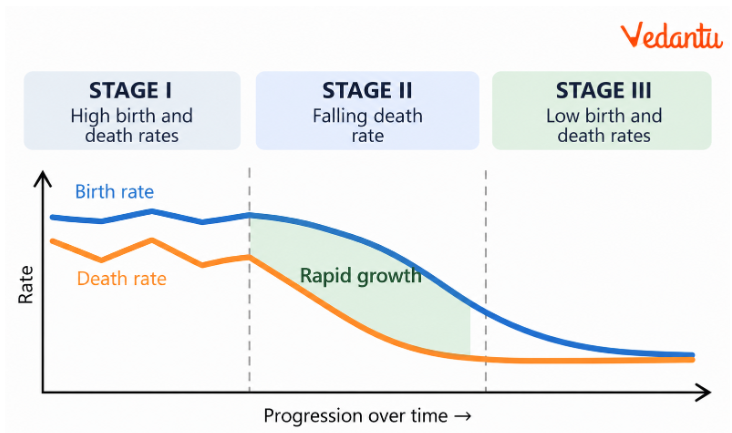
Stage I: High Fluctuating Stage
Both birth and death rates are high.
Population growth is slow.
High mortality results from factors such as epidemics and uncertain food supply.
Most people depend on agriculture.
Life expectancy and technological development are relatively low.
Stage II: Expanding Stage
Birth rates remain high initially but begin to decline over time.
Death rates fall because of improved healthcare, sanitation and living conditions.
The difference between births and deaths becomes large.
Population increases rapidly.
Stage III: Low Fluctuating Stage
Both birth and death rates are low.
Population growth slows or becomes relatively stable.
Societies are generally more urbanised, literate and technologically developed.
Families increasingly regulate their size.
Conclusion: Demographic transition theory shows how changes in economic and social development influence birth rates, death rates and population growth.
Q17. Explain how births, deaths and migration determine population change. Calculate the crude birth rate, crude death rate and actual population growth for the following region.
A region has:
Answer:
Population change depends on three components: births, deaths and migration.
Births increase population, deaths decrease it, and migration changes the population of the areas people enter or leave.
$$\begin{aligned} &\textbf{Step 1: Calculate the Crude Birth Rate.}\\[8pt] &\mathrm{CBR}=\dfrac{10,000}{5,00,000}\times 1,000\\[8pt] &\boxed{\mathrm{CBR}=20\text{ per 1,000 population}}\\[16pt] &\textbf{Step 2: Calculate the Crude Death Rate.}\\[8pt] &\mathrm{CDR}=\dfrac{4,000}{5,00,000}\times 1,000\\[8pt] &\boxed{\mathrm{CDR}=8\text{ per 1,000 population}}\\[16pt] &\textbf{Step 3: Calculate Natural Growth.}\\[8pt] &10,000-4,000=6,000\\[16pt] &\textbf{Step 4: Calculate Net Migration.}\\[8pt] &3,000-2,000=1,000\\[16pt] &\textbf{Step 5: Calculate Actual Growth.}\\[8pt] &\text{Actual Growth}=10,000-4,000+3,000-2,000\\[8pt] &\boxed{\text{Actual Growth}=7,000\text{ people}} \end{aligned}$$
Interpretation: The region gained 6,000 people through natural increase and another 1,000 through net migration.
This shows why births and deaths alone are not sufficient to explain the total population change of a region.
Q18. A rural family moves to an industrial city because farming income is uncertain. Explain this migration using origin, destination, push factors, pull factors and types of migration.
Answer: Migration refers to the movement of people from one place to another. The NCERT chapter explains that migration can alter the size of both the population at the place of origin and the population at the destination.
1. Place of Origin
The rural area the family leaves is its place of origin.
2. Place of Destination
The industrial city where the family moves is its place of destination.
3. Push Factors
These make the place of origin less attractive.
In this example, they may include:
Uncertain agricultural income
Limited employment opportunities
Poor access to educational and medical facilities
4. Pull Factors
These make the destination more attractive.
They may include:
Industrial employment
Better schools and hospitals
Improved transport
More reliable income opportunities
5. Type of Migration
The movement is classified as rural-to-urban migration.
Depending on how long the family remains in the city, it may be permanent or temporary.
6. Population Effects
The origin loses residents while the destination gains residents. Continued rural-to-urban migration can contribute to the expansion of cities.
Conclusion: The example shows how both difficulties at the origin and opportunities at the destination influence migration decisions.
Q19. Explain the importance of population-control measures and discuss Thomas Malthus's view on population growth.
Answer: The NCERT chapter discusses population-control measures in relation to population growth and the sustainable use of resources.
Part A: Population-Control Measures
1. Family Planning
Family planning involves spacing or preventing births. Access to family-planning services can help individuals and families make informed reproductive decisions.
2. Access to Contraception
The textbook identifies access to contraceptives as one measure used to limit rapid population growth.
3. Awareness and Information
Providing information about family planning and reproductive health helps people understand their options.
4. Policy Measures
The chapter also mentions tax disincentives for large families among population-control measures. These should be understood as measures discussed in the textbook, not as a recommendation to adopt any particular policy.
Part B: Thomas Malthus's Population Theory
In 1798, Thomas Malthus argued that the human population could grow faster than the food supply.
He believed that unchecked population growth could lead to shortages and crises involving famine, disease and war.
Malthus distinguished between preventive checks and checks arising from hardships or crises.
Part C: Relationship with Resources
The chapter highlights the need to consider population increase alongside the availability and sustainability of resources.
Conclusion: Population growth is connected with family planning, access to reproductive healthcare, resource availability and wider social and economic conditions.
Q20. A student claims that a country with a low birth rate must experience a declining population. Is this statement always correct? Explain with the concepts of positive growth, negative growth and migration.
Answer: No. A low birth rate does not automatically mean that a country's population will decline.
Population change depends on births, deaths and migration together.
1. Positive Population Growth
Population increases when the number of people added through births and migration exceeds the number lost through deaths and out-migration.
2. Negative Population Growth
Population declines when losses through deaths and out-migration exceed additions through births and in-migration.
3. Role of Migration
A country may have a low birth rate but still experience population growth if it receives enough migrants.
Similarly, a region may experience a population decline if people leave in large numbers, even when births exceed deaths.
4. Numerical Example
Consider a hypothetical country with the following annual figures:
Natural growth:
40,000 - 45,000 = -5,000
Net migration:
20,000 - 5,000 = 15,000
Actual growth:
-5,000 + 15,000 = 10,000
Interpretation: Although the country experiences negative natural growth, migration produces an overall population increase of 10,000 people.
Conclusion: Population growth cannot be determined from the birth rate alone. Deaths and migration must also be considered.
Why Practise Class 12 Geography Chapter 2 Important Questions with Vedantu?
Vedantu's Class 12 Geography Chapter 2 Important Questions help students practise population density calculations, understand why settlement patterns differ and explain how migration and demographic transition affect population growth.
How to Prepare Class 12 Geography Chapter 2 Important Questions with Vedantu?
Practise calculations: Solve population density, CBR, CDR and actual-growth questions using the correct formulas.
Compare settlement factors: Explain why places such as the Ganga plains, industrial belts and mountainous regions differ in population concentration.
Understand migration: Identify push and pull factors in real-life situations.
Revise demographic transition: Draw the three-stage model and explain changes in birth rates, death rates and population growth.
Prepare structured answers: Use NCERT examples and clear headings when explaining population distribution or population-control measures.
Practising these different question types helps students connect population concepts with geographical examples and improve the accuracy of descriptive and numerical answers.
Important Study Material Links for Class 12 Geography Chapter 2
CBSE Class 12 Geography other books Important Questions and Study Resources
Chapter-Wise Important Questions for Class 12 Geography – Fundamentals of Human Geography
Students looking for Class 12 Geography: Population Distribution, Density, Growth and Composition Question Answer resources can use this chapter to practise population distribution, density and growth. For other topics, explore the chapter-wise Important Questions from Fundamentals of Human Geography below.
Important Study Materials for Class 12 Geography
FAQs on Important Questions and Answers for Class 12 Geography Chapter 2 – The World Population: Distribution, Density and Growth (Fundamentals of Human Geography) | 2026-27
1. Why is world population unevenly distributed?
World population is unevenly distributed because places differ in water availability, landforms, climate, soil fertility, employment opportunities and social conditions. Plains, river valleys and industrial regions often attract more people than extreme deserts and difficult mountainous areas.
2. What is the formula for population density in Class 12 Geography?
Population density is calculated by dividing the total population of an area by its total land area.
$$\mathrm{Population\ Density} = \dfrac{\mathrm{Total\ Population}}{\mathrm{Total\ Area}}$$
It is usually expressed in persons per square kilometre.
3. Which geographical factors influence population distribution?
The four main geographical factors covered in this chapter are water availability, landforms, climate and soils. Together, they influence the suitability of an area for habitation, agriculture, transport and other activities.
4. What is the difference between population growth and population growth rate?
Population growth refers to the change in the number of inhabitants between two points in time. Population growth rate expresses that change as a percentage of the population at the beginning of the period.
5. How are crude birth rate and crude death rate calculated?
Crude birth rate is the number of live births per 1,000 people in a year, while crude death rate is the number of deaths per 1,000 people in a year. Both are calculated using the estimated mid-year population.
6. What is the difference between positive and negative population growth?
Positive population growth occurs when the population increases over a period. Negative population growth occurs when the population decreases. Births, deaths and migration together determine the actual change.
7. What are push and pull factors of migration?
Push factors are conditions that encourage people to leave a place, such as unemployment, epidemics and political unrest. Pull factors attract people to another place through better employment, education, healthcare and security.
8. Why is the second stage of demographic transition associated with rapid population growth?
During the second stage, improvements in sanitation, healthcare and living conditions reduce death rates, while birth rates remain high initially. This creates a large difference between births and deaths, resulting in rapid population growth.
9. What are the three stages of demographic transition theory?
The NCERT chapter describes three stages: a first stage with high birth and death rates, a second stage with declining mortality and rapid population growth, and a third stage with low birth and death rates and slow or stable population growth.
10. Where can I find Class 12 Geography Chapter 2 The World Population Distribution, Density and Growth important questions with answers?
Students can practise the 20 solved questions on this page, covering MCQs, short answers, calculations, migration and demographic transition. The accompanying PDF can be used for offline revision once it is published on the page.