


Class 12 Geography Chapter 1 Population: Distribution, Density, Growth and Composition Important Questions with Answers PDF
The Class 12 India People and Economy Chapter 1 Important Questions and Answers section contains 21 solved questions: five MCQs, four very short answers, six short answers and six long answers. The selection includes map-based questions, population-density calculations, the four phases of population growth, linguistic and religious composition, and Census 2011 workforce data.
Class 12 India People and Economy Chapter 1 Important Questions MCQ Practice
Q1. According to Census 2011, which Indian state had the highest population density among the following?
(a) West Bengal (b) Kerala (c) Uttar Pradesh (d) Bihar
Answer: (d) Bihar.
Explanation: Bihar had a population density of 1,102 persons per sq km in 2011. This was higher than West Bengal (1,029), Kerala (859) and Uttar Pradesh (828).
Q2. Which period is known as the population explosion phase in India?
(a) 1901–1921 (b) 1921–1951 (c) 1951–1981 (d) Post-1981
Answer: (c) 1951–1981.
Explanation: During 1951–1981, mortality declined rapidly while the birth rate remained high. This led to a sharp increase in India's population.
Q3. Which of the following is the largest language family in India?
(a) Austric (b) Sino-Tibetan (c) Dravidian (d) Indo-European
Answer: (d) Indo-European.
Q4. Which of the following best explains why the Northern Plains have a high concentration of population?
(a) Extremely cold climate and steep slopes
(b) Fertile soils, water availability and agricultural development
(c) Limited transport and settlement facilities
(d) Extensive deserts and poor water availability
Answer: (b) Fertile soils, water availability and agricultural development.
Explanation: The Northern Plains support a large population because of favourable relief, water resources, fertile agricultural land, long-established settlements and transport networks.
Q5. According to the Census 2011 data, which sector employed the largest share of India's working population?
(a) Primary sector (b) Secondary sector (c) Tertiary sector (d) Information technology sector
Answer: (a) Primary sector.
Class 12 Geography Chapter 1 Very Short Answer Questions
Q6. When was the first Census conducted in India, and when was the first complete Census held?
Answer: India's first Census was conducted in 1872, while the first complete Census was held in 1881. Population census operations are generally conducted every ten years.
Q7. What is population density? Write its formula.
Answer: Population density refers to the number of people living per unit area, usually expressed as persons per square kilometre.
Formula:
$$\text{Population Density}=\dfrac{\text{Total Population}}{\text{Total Geographical Area}}$$
India's population density was 382 persons per sq km in 2011.
Q8. What is meant by population doubling time?
Answer: Population doubling time is the period required for a population to become twice its original size if its current annual growth rate continues.
A higher growth rate generally means a shorter doubling time.
Q9. Define main workers and marginal workers according to Census 2011.
Answer:
Main Worker: A person who works for at least 183 days, or approximately six months, in a year.
Marginal Worker: A person who works for fewer than 183 days in a year.
These definitions help explain the composition of India's working population.
Class 12 Geography Chapter 1 Short Answer Questions
Q10. Why is India's population unevenly distributed? Explain the role of physical and socio-economic factors.
Answer: India's population distribution is influenced by natural conditions and the availability of economic opportunities.
1. Relief and Terrain
Flat plains are generally more suitable for settlements, agriculture and transport than steep mountain regions.
2. Climate
Areas with moderate climatic conditions can support larger settlements. Extremely cold, hot or dry conditions restrict population concentration.
3. Water Availability
River valleys, coastal plains and areas with reliable irrigation support agriculture and settlements.
4. Agricultural Development
Fertile land and established farming systems encourage a large rural population.
5. Industrialisation and Urbanisation
Cities such as Mumbai, Delhi, Bengaluru and Kolkata attract people because of employment, services and transport facilities.
Conclusion: The Northern Plains and coastal areas generally have high population concentrations, while the Himalayan region, deserts and difficult forested terrain often have lower concentrations.
Q11. Differentiate between arithmetic density, physiological density and agricultural density.
Answer: These three measures explain the relationship between people and land.
Formula:
Arithmetic Density
$$\text{Arithmetic Density}=\dfrac{\text{Total Population}}{\text{Total Geographical Area}}$$
Physiological Density
$$\text{Physiological Density}=\dfrac{\text{Total Population}}{\text{Net Cultivated Area}}$$
Agricultural Density
$$\text{Agricultural Density}=\dfrac{\text{Total Agricultural Population}}{\text{Net Cultivable Area}}$$
Explanation: Arithmetic density provides a general population measure, while physiological and agricultural densities help explain pressure on agricultural land.
Q12. Calculate the percentage growth of India's population between 2001 and 2011.
Answer:
According to the textbook:
Step 1: Write the formula.
$$\text{Decadal Growth Rate}=\dfrac{P_2-P_1}{P_1}\times100$$
Where:
P₁ = Population in 2001 P₂ = Population in 2011
Step 2: Calculate the increase.
$$P_2-P_1=1,210,193,422-1,028,610,328=181,583,094$$
Step 3: Calculate the percentage.
$$\text{Growth Rate}=\dfrac{181,583,094}{1,028,610,328}\times100\approx17.65\%$$
Final Answer: India's population increased by approximately 17.65% using the displayed population totals.
Q13. Why did India's population growth rate begin to decline gradually after 1981?
Answer: The population growth rate remained high after 1981 but began to slow down gradually.
The main reasons were:
Declining birth rate: Families increasingly had fewer children.
Female education: Improved education influenced decisions about marriage and family size.
Higher age at marriage: Later marriage contributed to lower fertility.
Improved living conditions: Better social and economic conditions influenced population behaviour.
Conclusion: Population continued to increase, but its rate of growth gradually declined.
Q14. Explain the differences between rural and urban population composition in India using Census 2011 data.
Answer: Rural–urban composition shows the proportion of people living in villages and towns or cities.
Q15. What is the difference between natural population growth and induced population growth?
Answer: Population growth refers to the change in the number of people living in an area over time.
Natural Growth:
A population increases naturally when births exceed deaths.
Induced Growth:
Migration affects population size because people move between regions.
Conclusion: Births, deaths and migration together influence population change, though the chapter mainly examines India's natural growth pattern.
Class 12 Geography Chapter 1 Long Answer Questions
Q16. Explain the spatial pattern of population density in India. Why do some regions have high density while others have low density?
Answer: Population density in India varies considerably because different regions have different physical conditions, resources and economic opportunities.
According to the 2011 census, India's average population density was 382 persons per sq km.
1. Areas of High Population Density
The Northern Plains contain some of India's most densely populated regions.
Important examples include:
Delhi is included for comparison but is a Union Territory, not a state.
High population density in these areas is associated with agricultural development, settlements, urbanisation and economic activities.
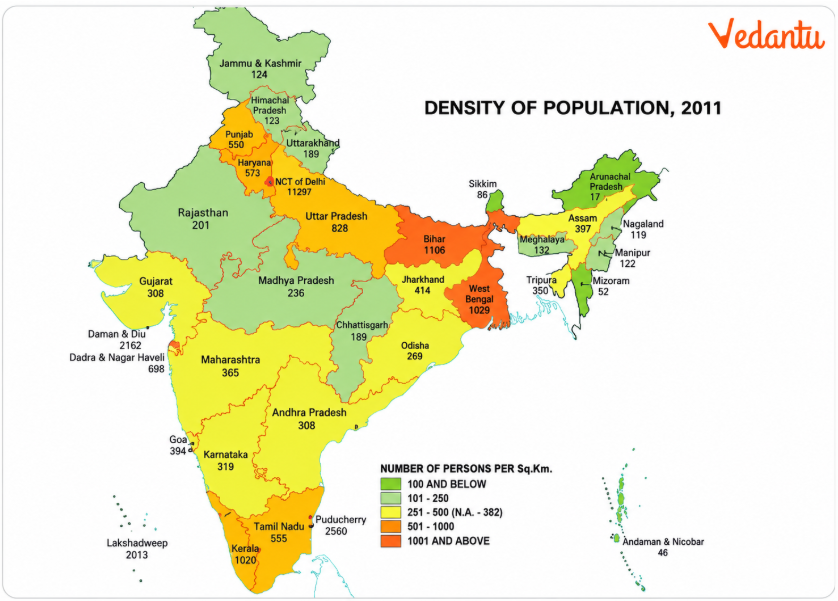
2. Areas of Low Population Density
Arunachal Pradesh had a population density of only 17 persons per sq km in 2011.
Low population density is also associated with parts of the Himalayan region, the north-eastern hills and arid regions.
3. Physical Factors
Steep slopes, difficult terrain, dense forests and harsh climatic conditions restrict settlements.
By contrast, plains and river valleys generally provide suitable conditions for farming, transport and habitation.
4. Economic Factors
Industries, transport networks, irrigation and employment opportunities increase population concentration.
5. Historical Factors
Regions with long-established agriculture and settlements continue to support large populations.
Conclusion: India's population density reflects the combined influence of natural conditions, historical settlement patterns and economic development.
Q17. Describe the four phases of population growth in India from 1901 onwards. Explain the major factors responsible for each phase.
Answer: India's population growth during the twentieth century and the subsequent period can be divided into four major phases.
1. Phase I: 1901–1921 – Stagnant or Stationary Growth
During this period, India's population growth rate was very low.
Important reasons included:
High birth rates.
High death rates.
Poor healthcare and medical facilities.
Illiteracy.
Inefficient distribution of food and essential goods.
The population even recorded negative growth between 1911 and 1921.
2. Phase II: 1921–1951 – Steady Population Growth
During this period, population growth became more consistent.
The main reasons were:
Improvement in healthcare and sanitation.
Declining mortality.
Better transport and communication.
Improved distribution of essential supplies.
The birth rate remained high, leading to greater population growth.
3. Phase III: 1951–1981 – Population Explosion
This period experienced rapid population growth.
The major causes were:
A sharp decline in death rates.
Continued high fertility.
Improved health facilities.
Better living conditions.
Development programmes after Independence.
4. Phase IV: Post-1981 – Gradual Decline in Growth Rate
India's population continued increasing, but the growth rate began to decline.
This was mainly associated with:
Falling birth rates.
Improved female education.
Increased age at marriage.
Better quality of life.
Comparison Table
Conclusion: The four phases show how improvements in health, living conditions and demographic behaviour changed India's population growth pattern.
Q18. Explain the rural–urban composition of India's population. Discuss why urbanisation varies between different regions.
Answer: Rural–urban composition describes how people are distributed between villages and towns or cities.
According to the 2011 Census, about 68.8% of India's population lived in rural areas, while 31.16% lived in urban areas.
1. Rural Population
Rural settlements are closely associated with agriculture and related economic activities. Relatively high rural population proportions in Himachal Pradesh and Bihar.
Village size and concentration vary because of relief, water availability, agricultural development, and settlement history.
2. Urban Population
Urban areas offer employment in industries, trade, transport and services.
Major cities attract people from rural areas in search of education, employment and improved opportunities.
3. Role of Rural–Urban Migration
Movement from villages to towns increases urban population.
Delhi–Kanpur.
Ahmedabad–Surat.
Mumbai and surrounding industrial areas.
Bengaluru–Mysuru.
Ludhiana–Jalandhar.
4. Regional Differences
Urbanisation is relatively limited in areas with difficult terrain, poor transport networks or fewer non-agricultural opportunities.
Industrial and commercial centres generally have higher urban concentrations.
5. Changes Over Time
Urban population has grown with economic development, improved transport, and rural–urban migration.
Conclusion: India's rural–urban composition reflects differences in economic activities, settlement development and opportunities across regions.
Q19. Discuss the linguistic and religious composition of India's population.
Answer: Population composition helps explain India's cultural diversity.
The chapter examines linguistic and religious groups using historical studies and Census 2011 data.
Part A: Linguistic Composition
India has a large number of languages and dialects.
Explanation: The Indo-European family has the largest share in the classification reproduced in the textbook.
Part B: Religious Composition
The major religious communities had the following shares in Census 2011:
Part C: Regional Patterns
The chapter discusses several examples:
Sikh populations are strongly concentrated in Punjab and nearby areas.
Christian communities are important in parts of the north-east and along the western coast.
Jain communities have significant concentrations in parts of Rajasthan, Gujarat and Maharashtra.
Buddhist communities are present in Maharashtra and several Himalayan areas.
Conclusion: India's linguistic and religious composition reflects the country's cultural diversity and long history of migration and settlement.
Q20. Explain the occupational structure of India's population according to Census 2011. What does the distribution of workers reveal about the economy?
Answer: Occupational structure shows the types of economic activities in which people are engaged.
1. Classification by Working Status
2. Major Occupational Categories
Cultivators.
Agricultural labourers.
Household industrial workers.
Other workers.
3. Sectoral Composition of Workers
The chapter uses a Census-based grouping in which the secondary category refers to household industrial workers, while other workers are included in the remaining category. Students should follow the textbook's classification rather than treating these percentages as the current economy-wide employment shares for all manufacturing and services.
4. Importance of the Primary Sector
The primary sector had the largest share of workers in 2011.
This indicates that agriculture remained an important source of employment.
5. Change in Occupational Structure
The textbook shows that the agricultural share of workers declined from 58.2% in 2001 to 54.6% in 2011.
This indicates a gradual movement towards non-farm activities.
6. Regional Variation
Himachal Pradesh and Nagaland are highlighted for their relatively large shares of cultivators.
Bihar, Odisha and several other states have significant agricultural labour populations.
Highly urbanised areas such as Delhi and Chandigarh have larger shares of workers in other services.
Conclusion: India's occupational structure shows the continuing importance of agriculture alongside the gradual growth of non-agricultural employment.
Q21. Explain the importance of India's adolescent population and the major challenges affecting its development.
Answer: Adolescents form an important part of India's population because they represent a major source of future human resources.
According to the textbook, adolescents aged 10–19 constituted approximately 20.9% of India's population in 2011.
1. Importance of Adolescents
A healthy and educated adolescent population can contribute to:
Economic development.
Skilled employment.
Innovation and productivity.
Social development.
2. Major Challenges
Early marriage.
Illiteracy and school dropouts.
Nutritional deficiencies.
Health-related risks.
Drug abuse and other social problems.
Unequal educational opportunities.
3. Role of Education
Education helps adolescents develop knowledge, skills and better employment opportunities.
It also supports informed decisions about health, careers and family life.
4. National Youth Policy 2014
The textbook discusses the National Youth Policy 2014, which defines youth as people aged 15–29 years.
Its objective is to help young people develop their potential and contribute to national development.
5. Skill Development
The National Policy for Skill Development and Entrepreneurship, 2015, aims to strengthen and coordinate skill-development activities.
Conclusion: Supporting adolescents through education, healthcare and skills can help India make better use of its human resources.
Why Practise Class 12 Geography Chapter 1 Important Questions with Vedantu?
Practising these Class 12 Geography Chapter 1 Important Questions helps students understand how India's population is distributed, why population density differs between regions and how demographic patterns changed during the twentieth century. Students can also revise important Census 2011 figures and practise questions on rural–urban, linguistic, religious and occupational composition.
How to Prepare Class 12 Geography Chapter 1 Important Questions with Vedantu?
Revise Census 2011 carefully: Memorise the population-density figures and identify the states.
Practise population formulas: Understand arithmetic density, physiological density, agricultural density and decadal growth rate.
Prepare the four growth phases: Learn the period, major characteristics and reasons for each phase.
Study the maps: Compare population distribution and density across plains, mountains, deserts and cities.
Understand population composition: Revise the rural–urban, linguistic, religious and occupational tables.
Practise long answers: Explain geographical patterns with relevant examples instead of memorising figures without context.
Important Study Material Links for Class 12 Geography Chapter 1
CBSE Class 12 Geography other books Important Questions and Study Resources
Chapter-Wise Important Questions for Class 12 Geography – India: People and Economy
Students can continue practising questions from the remaining chapters of India: People and Economy to understand Indian settlements, resources, agriculture, industries and transport.
Important Study Materials for Class 12 Geography
FAQs on Important Questions and Answers for Class 12 Geography Chapter 1 – Population: Distribution, Density, Growth and Composition (India: People and Economy) | 2026-27
1. What are the main topics covered in Class 12 Geography India: People and Economy Chapter 1?
The chapter covers India's population distribution, density, growth and composition. Important topics include population-density formulas, four phases of population growth, rural–urban population, language families, religious composition and occupational structure.
2. What was India's population according to Census 2011?
India's population was approximately 1,210 million, or 121 crore, according to the 2011 Census. The chapter uses these historical Census figures to explain population distribution and growth.
3. Why is India's population unevenly distributed?
Relief, climate, water availability, fertile land, transport, industries and urban employment influence population distribution. River plains and major urban areas generally have higher concentrations than difficult mountain and desert regions.
4. Which Indian state had the highest population density in Census 2011?
Among Indian states, Bihar had the highest population density at 1,102 persons per sq km. Delhi had a higher density but is a Union Territory.
5. What is the difference between population distribution and population density?
Population distribution describes where people live across a geographical area. Population density measures how many people live per unit area, usually per square kilometre.
6. Why is 1921 considered an important year in India's population growth history?
The period ending in 1921 experienced very low or negative population growth. After 1921, population growth became steadier as health, sanitation and living conditions improved. This is why 1921 is commonly called the Year of Great Divide in India's demographic history.
7. What caused India's population explosion between 1951 and 1981?
Death rates declined rapidly because of better healthcare and living conditions, while birth rates remained high. This gap led to a sharp population increase.
8. What was the rural–urban composition of India's population in Census 2011?
Approximately 68.8% of the population lived in rural areas, while 31.16% lived in urban areas. The distribution reflects the importance of agriculture and the growing influence of urbanisation.
9. What is the difference between a main worker and a marginal worker?
A main worker works at least 183 days a year, while a marginal worker works fewer than 183 days. These are Census classifications used to study economic participation.
10. Which occupational sector employed the largest share of India's workers in 2011?
The primary sector accounted for 54.6% of the working population according to the Census 2011 grouping. Agriculture and related activities were therefore major sources of employment.
11. What are the four major language families discussed in Class 12 Geography Chapter 1?
The four language families are Indo-European, Dravidian, Austric and Sino-Tibetan. The Indo-European family is the largest in the textbook's linguistic classification.
12. How should students prepare for the map-based and data-based questions from this chapter?
Students should revise the maps of population distribution, density and growth, along with Census 2011 tables. Practise identifying high- and low-density regions, calculating population growth and explaining the geographical reasons behind the patterns.