Data Handling And Presentation Questions and Answers - Free PDF Download
FAQs on NCERT Solutions For Class 6 Maths Chapter 4 Data Handling And Presentation Exercise 4.2 (2025-26)
1. What is a pictograph in Maths?
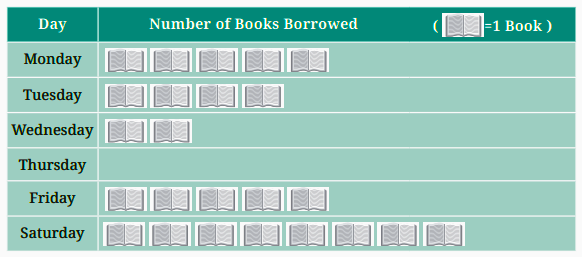
A pictograph is a way of representing data using pictures or symbols, where each picture represents a certain number of items.
2. Why is using pictographs helpful in data handling?
Pictographs make it easier to visually interpret data and quickly identify patterns or trends.
3. What does each symbol in a pictograph represent?
Each symbol or picture in a pictograph represents a fixed number of items, which is usually indicated in the key provided with the graph.
4. How does Exercise 4.2 help students understand pictographs?
Exercise 4.2 teaches students how to create and interpret pictographs, helping them to visually organize and present data in a simple way.
5. How are pictographs used in real life?
Pictographs are commonly used in charts, infographics, and reports to visually display data in fields like business, education, and research.
6. What kind of questions are covered in Exercise 4.2?
The exercise includes questions that ask students to both create pictographs from given data and interpret existing pictographs.
7. Why is it important to use a key in pictographs?
A key indicates the value of each symbol, helping readers understand how many items are represented by the pictures.
8. How do Vedantu’s NCERT Solutions help with pictographs?
Vedantu’s NCERT Solutions provide step-by-step explanations, making it easy for students to understand how to create and interpret pictographs effectively.
9. How do pictographs improve data interpretation skills?
Pictographs help students develop skills in quickly analyzing and interpreting data in a visual format, enhancing their problem-solving abilities.
10. Can pictographs be used to represent any type of data?
Yes, pictographs can represent various types of data, but they are especially useful for small datasets where visual representation is more impactful.
11. What is the most important aspect of reading a pictograph?
The most important aspect is understanding the key, which tells you what each symbol represents in terms of quantity.
12. How can students practice creating pictographs?
Students can practice creating pictographs by working through the questions in Exercise 4.2 and referring to Vedantu’s solutions for guidance.
13. How do pictographs make data easier to understand?
Pictographs convert numerical data into visual information, allowing students to interpret and process data more easily and quickly.


