


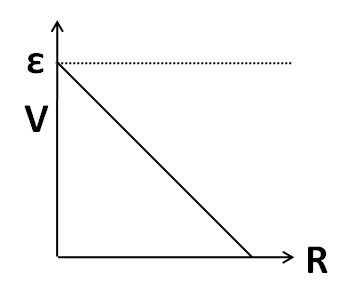
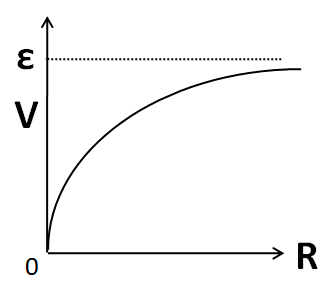
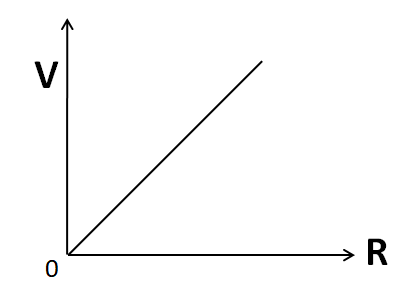
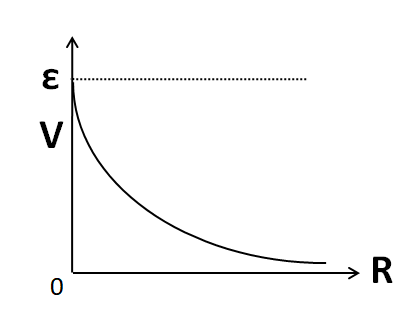
A cell having an emf $\varepsilon $ and internal resistance $r$ is connected across a variable external resistance $R$. As the resistance $R$ is increased, the plot of potential difference $V$ across $R$ is given by-
(A)
(B)
(C)
(D)
Answer
254.4k+ views
Hint: To solve this question, we need to draw the circuit diagram according to the given information. Then using the Ohm’s law we can find out the expression for the potential difference across the external resistor in terms of the external resistance. From there we can predict the shape of the graph.
Complete step-by-step solution:
According to the information given in the question, a cell of emf $\varepsilon $ and internal resistance $r$ is connected across a variable external resistance $R$. So we can represent this information by the circuit diagram shown below.
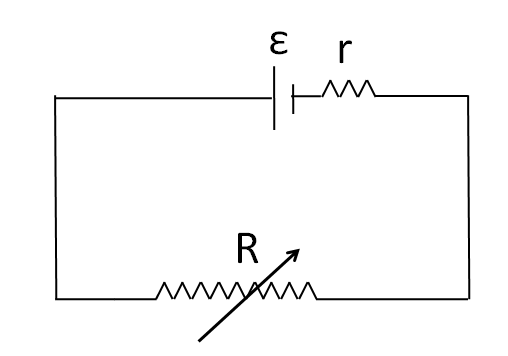
Let the current in the circuit be $I$. The internal resistance and the external resistance are connected in series combination with each other. So the net resistance in the circuit is
${R_N} = R + r$ ……………………...(1)
From the Ohm’s law we can write
$\varepsilon = I{R_N}$
From (1)
$\varepsilon = I\left( {R + r} \right)$
$ \Rightarrow I = \dfrac{\varepsilon }{{R + r}}$................(2)
Now, the potential difference across the resistance is given by the Ohm’s law as
$V = IR$
Substituting (2) we get
$V = \dfrac{{\varepsilon R}}{{R + r}}$..........................(3)
Since the independent variable $R$ is appearing at both the numerator and the denominator, so we have to simplify the above equation (3), which can also be written as
$V = \dfrac{{\varepsilon \left( {R + r - r} \right)}}{{R + r}}$
$V = \varepsilon - \dfrac{{\varepsilon r}}{{R + r}}$...............................(4)
So now we have the independent variable $R$ only in the denominator. Now, we substitute in (4) to get
$V\left( 0 \right) = \varepsilon - \dfrac{{\varepsilon r}}{{0 + r}}$
$ \Rightarrow V\left( 0 \right) = 0$
So for $R = 0$, we have $V = 0$. So the plot must pass through the origin. As we can see that the plots given in the options A and D do not pass through the origin, so they must be incorrect.
Therefore options A and D are incorrect.
Now, we take the limit $R \to \infty $ at both sides in (4) to get
$\mathop {\lim }\limits_{R \to \infty } V = \mathop {\lim }\limits_{R \to \infty } \left( {\varepsilon - \dfrac{{\varepsilon r}}{{R + r}}} \right)$
\[ \Rightarrow \mathop {\lim }\limits_{R \to \infty } V = \varepsilon - \varepsilon r\mathop {\lim }\limits_{R \to \infty } \left( {\dfrac{1}{{R + r}}} \right)\]
We know that $\mathop {\lim }\limits_{x \to \infty } \left( {\dfrac{1}{{x + k}}} \right) = 0$. Therefore we have
\[\mathop {\lim }\limits_{R \to \infty } V = \varepsilon - \varepsilon r\left( 0 \right)\]
\[ \Rightarrow \mathop {\lim }\limits_{R \to \infty } V = \varepsilon \]
So the ordinate of the plot will approach the value $\varepsilon $ as the variable resistance $R$ is infinitely increased.
In the plot shown in option B, we can see this happening.
Hence, the correct answer is option B.
Note: Do not try to obtain the plot by using transformations of the graph. Although we can obtain the plot by that method also, that would take much time and also chances of mistakes are huge. So after getting the equation, always guess the plot by substituting the end point values and taking the limits.
Complete step-by-step solution:
According to the information given in the question, a cell of emf $\varepsilon $ and internal resistance $r$ is connected across a variable external resistance $R$. So we can represent this information by the circuit diagram shown below.
Let the current in the circuit be $I$. The internal resistance and the external resistance are connected in series combination with each other. So the net resistance in the circuit is
${R_N} = R + r$ ……………………...(1)
From the Ohm’s law we can write
$\varepsilon = I{R_N}$
From (1)
$\varepsilon = I\left( {R + r} \right)$
$ \Rightarrow I = \dfrac{\varepsilon }{{R + r}}$................(2)
Now, the potential difference across the resistance is given by the Ohm’s law as
$V = IR$
Substituting (2) we get
$V = \dfrac{{\varepsilon R}}{{R + r}}$..........................(3)
Since the independent variable $R$ is appearing at both the numerator and the denominator, so we have to simplify the above equation (3), which can also be written as
$V = \dfrac{{\varepsilon \left( {R + r - r} \right)}}{{R + r}}$
$V = \varepsilon - \dfrac{{\varepsilon r}}{{R + r}}$...............................(4)
So now we have the independent variable $R$ only in the denominator. Now, we substitute in (4) to get
$V\left( 0 \right) = \varepsilon - \dfrac{{\varepsilon r}}{{0 + r}}$
$ \Rightarrow V\left( 0 \right) = 0$
So for $R = 0$, we have $V = 0$. So the plot must pass through the origin. As we can see that the plots given in the options A and D do not pass through the origin, so they must be incorrect.
Therefore options A and D are incorrect.
Now, we take the limit $R \to \infty $ at both sides in (4) to get
$\mathop {\lim }\limits_{R \to \infty } V = \mathop {\lim }\limits_{R \to \infty } \left( {\varepsilon - \dfrac{{\varepsilon r}}{{R + r}}} \right)$
\[ \Rightarrow \mathop {\lim }\limits_{R \to \infty } V = \varepsilon - \varepsilon r\mathop {\lim }\limits_{R \to \infty } \left( {\dfrac{1}{{R + r}}} \right)\]
We know that $\mathop {\lim }\limits_{x \to \infty } \left( {\dfrac{1}{{x + k}}} \right) = 0$. Therefore we have
\[\mathop {\lim }\limits_{R \to \infty } V = \varepsilon - \varepsilon r\left( 0 \right)\]
\[ \Rightarrow \mathop {\lim }\limits_{R \to \infty } V = \varepsilon \]
So the ordinate of the plot will approach the value $\varepsilon $ as the variable resistance $R$ is infinitely increased.
In the plot shown in option B, we can see this happening.
Hence, the correct answer is option B.
Note: Do not try to obtain the plot by using transformations of the graph. Although we can obtain the plot by that method also, that would take much time and also chances of mistakes are huge. So after getting the equation, always guess the plot by substituting the end point values and taking the limits.
Recently Updated Pages
Mass vs Weight: Key Differences Explained for Students
Uniform Acceleration Explained: Formula, Examples & Graphs
JEE Main 2022 (June 25th Shift 2) Chemistry Question Paper with Answer Key
Average Atomic Mass - Important Concepts and Tips for JEE
JEE Main 2023 (April 15th Shift 1) Physics Question Paper with Answer Key
JEE Main 2022 (June 27th Shift 2) Chemistry Question Paper with Answer Key
Trending doubts
JEE Main 2026: Exam Dates, Session 2 Updates, City Slip, Admit Card & Latest News
JEE Main Marking Scheme 2026- Paper-Wise Marks Distribution and Negative Marking Details
JEE Main 2026 Application Login: Direct Link, Registration, Form Fill, and Steps
Hybridisation in Chemistry – Concept, Types & Applications
Understanding the Electric Field of a Uniformly Charged Ring
Derivation of Equation of Trajectory Explained for Students
Other Pages
CBSE Class 12 Physics Question Paper 2026: Download SET-wise PDF with Answer Key & Analysis
JEE Advanced 2026 - Exam Date (Released), Syllabus, Registration, Eligibility, Preparation, and More
JEE Advanced Marks vs Ranks 2025: Understanding Category-wise Qualifying Marks and Previous Year Cut-offs
JEE Advanced Weightage 2025 Chapter-Wise for Physics, Maths and Chemistry
Understanding Atomic Structure for Beginners
Ideal and Non-Ideal Solutions Explained for Class 12 Chemistry