


The given plots represent the variation of the concentration of a reactant R with time for two different reactions (i) and (ii). The respective orders of the reaction are:
i)

ii)

A) 1 ,0
B) 1 , 1
C) 0 , 1
D) 0, 2
| i) |
|
| ii) |
|
Answer
604.2k+ views
Hint: The order of the reaction is the sum of the powers to which the concentration terms are raised in the rate –law expression. Thus reaction is said to be first order if the expression is of type $\text{ Rate = k}\left[ \text{A} \right]\text{ }$.
Complete step to step solution: We can reduce the integrated rate law by considering the change in the concentration and time interval. Thus integrated rate law can be further modified to fits in the straight line equation, $\text{ y = mx + c }$
-Where m is the slope and c is the intercept in the plot.
1) Let's consider a reaction of conversion of reactant A to the product P, $\text{ A}\to \text{ P }$. The rate of the reaction depends on the concentration of reactant A.
$\text{ Rate = k}\left[ \text{A} \right]\text{ }$
-On applying the integrated rate expression for the change of concentration from $\text{ }{{\left[ A \right]}_{0}}\text{ }$ $\text{ }\left[ A \right]\text{ }$ within the time interval of 0 to t, the integrated rate law is written as $\text{ }{{\text{k}}_{1}}\text{ = }\dfrac{1}{t}\ ln \dfrac{a}{a-x}\text{ }$. This shows that the concentration of a reactant in a first-order reaction decreases exponentially with time. The graph of concentration ‘c’ against the time ‘t’ is as shown below,
Graph
-The rate equation can be rearranged as,
$\begin{align}
& \text{ }{{\text{k}}_{1}}\text{t = }\ln a-\ln \text{ }\left( a-x \right) \\
& \Rightarrow \ln \left( a-x \right)\text{ = }-{{\text{k}}_{1}}\text{t + }\ln a \\
& \Rightarrow \ln c\text{ = }-{{\text{k}}_{1}}\text{t + }\ln {{c}_{0}} \\
\end{align}$
-The equation is similar to the straight-line equation $\text{ y = mx + c }$ .
-Therefore, on comparing we get that y is equal to $\ln c$ , the slope is equal to $\text{ - k }$ and intercept is equal to $\text{ }\ln {{c}_{0}}\text{ }$. Thus, on plotting the graph of $\ln c$ against the time ‘t’, we get the straight-line plot with the negative slope as shown below,

This represents the first-order reaction.
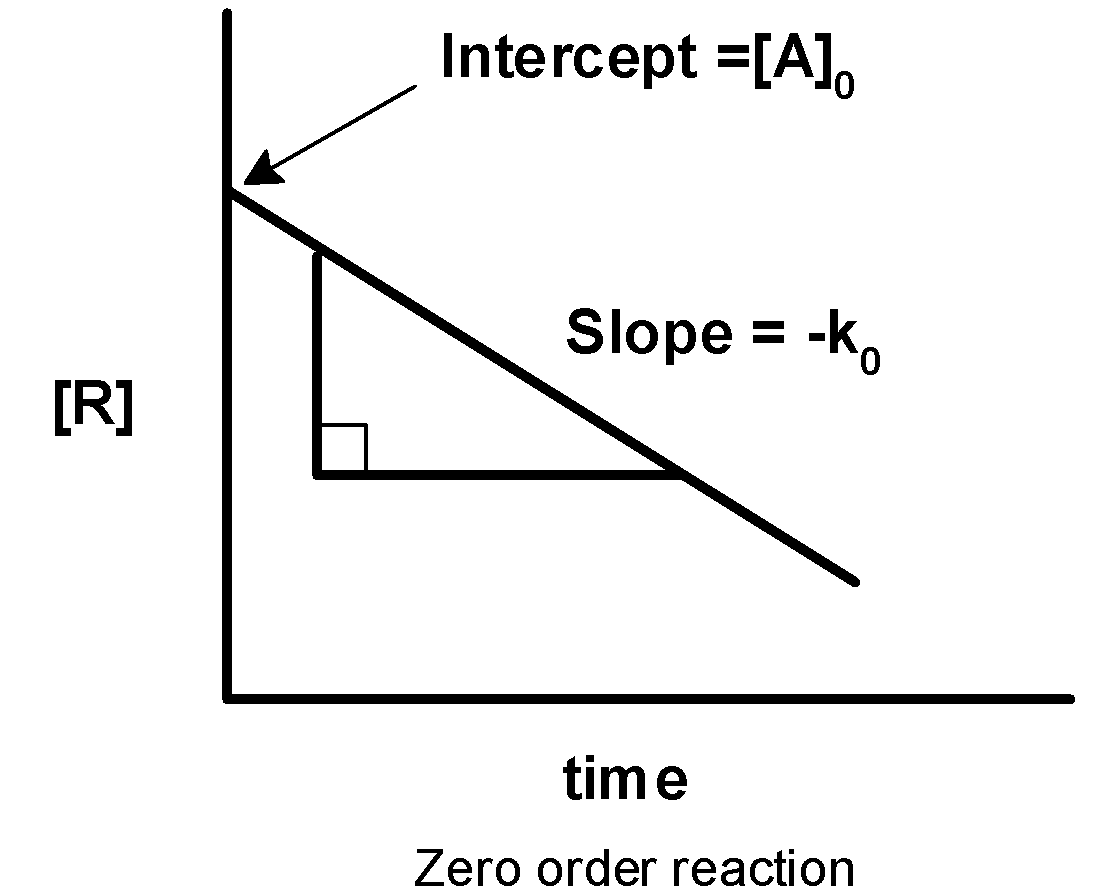
2) Let's consider a conversion of reactants to products where the rate of reaction is not affected by changes in concentration of one or more reactants. This is called the zero-order reaction. In such case for the conversion of $\text{ A}\to \text{ P }$, the rate expression is written as, $\text{ Rate = k}{{\left[ \text{A} \right]}^{0}}\text{ = k }$
-At the time $\text{ t = 0 }$ , the concentration is $\text{ }{{\left[ A \right]}_{0}}\text{ }$and at ‘t’ it changes to $\text{ }\left[ A \right]\text{ }$. The integrated rate law for the zero-order kinetic reaction is,
$\text{ }$ $\text{ }{{\text{k}}_{0}}\text{ = }\dfrac{1}{t}\left( \text{ }{{\left[ A \right]}_{0}}\text{ }-\text{ }\left[ A \right]\text{ } \right)\text{ }$
-Thus, the equation can be rearranged as,
$\begin{align}
& \text{ }{{\text{k}}_{0}}\text{ = }\dfrac{1}{t}\left( \text{ }{{\left[ A \right]}_{0}}\text{ }-\text{ }\left[ A \right]\text{ } \right)\text{ } \\
& \Rightarrow {{\text{k}}_{0}}t\text{ = }{{\left[ A \right]}_{0}}\text{ }-\text{ }\left[ A \right] \\
& \Rightarrow \left[ A \right]\text{ =}-{{\text{k}}_{0}}t\text{ + }{{\left[ A \right]}_{0}} \\
\end{align}$
-On comparing with the straight-line equation, the plot of $\text{ }\left[ A \right]\text{ }$against the time ‘t’ has the slope of $\text{ }-{{k}_{0}}$ and intercept equal to $\text{ }{{\left[ A \right]}_{0}}\text{ }$.
-Thus, when we plot a graph of the concentration of reactant against the time the graph is obtained as follows,
Thus, plot i) if first-order reaction and ii) is a zero-order reaction.
Hence, (A) is the correct option.
Note: Note that the rate of zero-order reaction is independent of the concentration of the reactant. Thus the rate of reaction for such reactions is determined by some other limiting factor such as the amount of catalyst used in catalytic reaction or the intensity of light absorbed in a photochemical reaction. The second-order kinetic reaction is given by the graph $\text{ }\dfrac{1}{[A]}$ against the t.
Complete step to step solution: We can reduce the integrated rate law by considering the change in the concentration and time interval. Thus integrated rate law can be further modified to fits in the straight line equation, $\text{ y = mx + c }$
-Where m is the slope and c is the intercept in the plot.
1) Let's consider a reaction of conversion of reactant A to the product P, $\text{ A}\to \text{ P }$. The rate of the reaction depends on the concentration of reactant A.
$\text{ Rate = k}\left[ \text{A} \right]\text{ }$
-On applying the integrated rate expression for the change of concentration from $\text{ }{{\left[ A \right]}_{0}}\text{ }$ $\text{ }\left[ A \right]\text{ }$ within the time interval of 0 to t, the integrated rate law is written as $\text{ }{{\text{k}}_{1}}\text{ = }\dfrac{1}{t}\ ln \dfrac{a}{a-x}\text{ }$. This shows that the concentration of a reactant in a first-order reaction decreases exponentially with time. The graph of concentration ‘c’ against the time ‘t’ is as shown below,
Graph
-The rate equation can be rearranged as,
$\begin{align}
& \text{ }{{\text{k}}_{1}}\text{t = }\ln a-\ln \text{ }\left( a-x \right) \\
& \Rightarrow \ln \left( a-x \right)\text{ = }-{{\text{k}}_{1}}\text{t + }\ln a \\
& \Rightarrow \ln c\text{ = }-{{\text{k}}_{1}}\text{t + }\ln {{c}_{0}} \\
\end{align}$
-The equation is similar to the straight-line equation $\text{ y = mx + c }$ .
-Therefore, on comparing we get that y is equal to $\ln c$ , the slope is equal to $\text{ - k }$ and intercept is equal to $\text{ }\ln {{c}_{0}}\text{ }$. Thus, on plotting the graph of $\ln c$ against the time ‘t’, we get the straight-line plot with the negative slope as shown below,
This represents the first-order reaction.
2) Let's consider a conversion of reactants to products where the rate of reaction is not affected by changes in concentration of one or more reactants. This is called the zero-order reaction. In such case for the conversion of $\text{ A}\to \text{ P }$, the rate expression is written as, $\text{ Rate = k}{{\left[ \text{A} \right]}^{0}}\text{ = k }$
-At the time $\text{ t = 0 }$ , the concentration is $\text{ }{{\left[ A \right]}_{0}}\text{ }$and at ‘t’ it changes to $\text{ }\left[ A \right]\text{ }$. The integrated rate law for the zero-order kinetic reaction is,
$\text{ }$ $\text{ }{{\text{k}}_{0}}\text{ = }\dfrac{1}{t}\left( \text{ }{{\left[ A \right]}_{0}}\text{ }-\text{ }\left[ A \right]\text{ } \right)\text{ }$
-Thus, the equation can be rearranged as,
$\begin{align}
& \text{ }{{\text{k}}_{0}}\text{ = }\dfrac{1}{t}\left( \text{ }{{\left[ A \right]}_{0}}\text{ }-\text{ }\left[ A \right]\text{ } \right)\text{ } \\
& \Rightarrow {{\text{k}}_{0}}t\text{ = }{{\left[ A \right]}_{0}}\text{ }-\text{ }\left[ A \right] \\
& \Rightarrow \left[ A \right]\text{ =}-{{\text{k}}_{0}}t\text{ + }{{\left[ A \right]}_{0}} \\
\end{align}$
-On comparing with the straight-line equation, the plot of $\text{ }\left[ A \right]\text{ }$against the time ‘t’ has the slope of $\text{ }-{{k}_{0}}$ and intercept equal to $\text{ }{{\left[ A \right]}_{0}}\text{ }$.
-Thus, when we plot a graph of the concentration of reactant against the time the graph is obtained as follows,
Thus, plot i) if first-order reaction and ii) is a zero-order reaction.
Hence, (A) is the correct option.
Note: Note that the rate of zero-order reaction is independent of the concentration of the reactant. Thus the rate of reaction for such reactions is determined by some other limiting factor such as the amount of catalyst used in catalytic reaction or the intensity of light absorbed in a photochemical reaction. The second-order kinetic reaction is given by the graph $\text{ }\dfrac{1}{[A]}$ against the t.
Recently Updated Pages
Master Class 12 Economics: Engaging Questions & Answers for Success
Master Class 12 English: Engaging Questions & Answers for Success
Master Class 12 Social Science: Engaging Questions & Answers for Success
Master Class 12 Maths: Engaging Questions & Answers for Success
Master Class 12 Physics: Engaging Questions & Answers for Success
Master Class 9 General Knowledge: Engaging Questions & Answers for Success
Trending doubts
Which are the Top 10 Largest Countries of the World?
Draw a labelled sketch of the human eye class 12 physics CBSE
Differentiate between homogeneous and heterogeneous class 12 chemistry CBSE
Sulphuric acid is known as the king of acids State class 12 chemistry CBSE
Why is the cell called the structural and functional class 12 biology CBSE
A dentist uses a small mirror that gives a magnification class 12 physics CBSE