


Plot a graph showing the variation of current I versus resistance R, connected to a cell of emf E and the internal resistance r.
Answer
586.8k+ views
Hint: The above problem can be resolved by using the concepts and applications of the ohm's law; The ohm’s laws are one of the fundamentals law that says that in an electrical circuit if the circuit consists of some arrangements of resistance and the voltages. Then, the magnitude of voltage being supplied to the circuit. Moreover, the ohm’s law also relates the current and resistances, that show the inverse relations in the context of each other.
Complete step by step answer:
Let us consider an electrical circuit, which contains a resistor of resistance R and the internal resistance of r.
If E be the value of electromotive force supplied to the electrical circuit and I be the magnitude of current flow through the circuit.
Then, we will apply the Ohm’s law formula as,
\[E = I \times R\]
On keeping the value of EMF constant, the variation of current and the resistance is,
\[\begin{array}{l}
E = I \times R\\
I \propto \dfrac{1}{R}
\end{array}\]
Then the graph for the above result is given as,
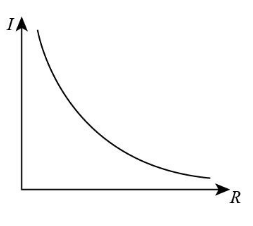
Thus, from the above graph shows that the magnitude of current varies inversely with the magnitude of resistance of the electrical circuit taken into the analysis and the graph between current and resistance is hyperbolic.
Note:Try to understand the concepts and fundamentals involved in the analysis of Ohm's law. The ohm’s law is one of the basic laws that is largely used to design any electrical circuit, along with the analysis of the various terms related with the analysis, like voltage supply, current and the magnitude of resistance.
Complete step by step answer:
Let us consider an electrical circuit, which contains a resistor of resistance R and the internal resistance of r.
If E be the value of electromotive force supplied to the electrical circuit and I be the magnitude of current flow through the circuit.
Then, we will apply the Ohm’s law formula as,
\[E = I \times R\]
On keeping the value of EMF constant, the variation of current and the resistance is,
\[\begin{array}{l}
E = I \times R\\
I \propto \dfrac{1}{R}
\end{array}\]
Then the graph for the above result is given as,
Thus, from the above graph shows that the magnitude of current varies inversely with the magnitude of resistance of the electrical circuit taken into the analysis and the graph between current and resistance is hyperbolic.
Note:Try to understand the concepts and fundamentals involved in the analysis of Ohm's law. The ohm’s law is one of the basic laws that is largely used to design any electrical circuit, along with the analysis of the various terms related with the analysis, like voltage supply, current and the magnitude of resistance.
Recently Updated Pages
Master Class 12 Economics: Engaging Questions & Answers for Success
Master Class 12 Physics: Engaging Questions & Answers for Success
Master Class 12 English: Engaging Questions & Answers for Success
Master Class 12 Social Science: Engaging Questions & Answers for Success
Master Class 12 Maths: Engaging Questions & Answers for Success
Master Class 12 Business Studies: Engaging Questions & Answers for Success
Trending doubts
Which are the Top 10 Largest Countries of the World?
What are the major means of transport Explain each class 12 social science CBSE
Draw a labelled sketch of the human eye class 12 physics CBSE
Why cannot DNA pass through cell membranes class 12 biology CBSE
Differentiate between insitu conservation and exsitu class 12 biology CBSE
Draw a neat and well labeled diagram of TS of ovary class 12 biology CBSE