


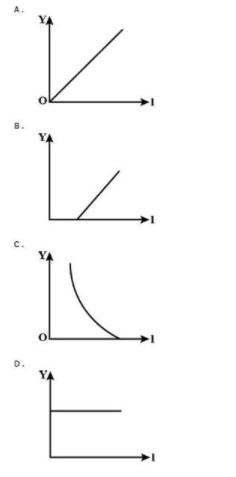
In an experiment on the photoelectric effect, an evacuated photocell with a pure metal cathode is used. Which graph best represents the variation of $V$, the minimum potential difference to prevent current from flowing, when $x$, the frequency of the incident light, is varied?
Answer
593.4k+ views
Hint: Try to get the equation of straight line, $y = mx + c$, by manipulating the Einstein‘s equation for Photoelectric effect, that is, ${E_{\max }} = hf - {\phi _0}$.
Complete step by step solution:
We know, the Einstein’s equation for photoelectric effect is given by,
${E_{\max }} = hf - {\phi _0}$
Where, ${E_{\max }} = $maximum kinetic energy of the electrons that are emitted from the cathode
$h = $Planck’s constant
$f = $frequency of the incident light
${\phi _0} = h{f_0} = $work function of the metal from where the electron is emitting and it is related to the threshold frequency ${f_0}$.
The work function of the metal is the minimum amount of work of energy required to take a free-electron out of the metal against the force that is exerted by the surrounding positive ion.
When a particular amount of negative potential difference $V$ is applied to the anode A, the current becomes zero in the photoelectric tube. This is the value of negative potential difference which just stops the electrons with maximum energy from reaching anode A. This $V$ is known as stopping potential.
Therefore,
$eV = {E_{\max }}$
We have, \[{E_{\max }} = hf - {\phi _0} \cdot \cdot \cdot \cdot \cdot \cdot \left( 1 \right)\]
Substitute ${\phi _0} = h{f_0}$ in equation$\left( 1 \right)$, so we get
${E_{\max }} = hf - h{f_0}$
Since, ${E_{\max }} = eV$
Therefore,
$
hf - h{f_0} = eV \\
h\left( {f - {f_0}} \right) = eV \\
$
Or $V = \dfrac{h}{e}\left( {f - {f_0}} \right)$
This equation can be interpret as:
$y = \dfrac{h}{e}\left( {x - {x_0}} \right)$, which form the equation of a straight line of gradient $\dfrac{h}{e}$.
So when the graph is plotted showing the variation of minimum potential difference on the y-axis against the frequency of incident light on the x-axis, a straight line is drawn cutting the x-axis at ${f_0}$. The best graph representing it is option B.
$\therefore$ Hence the correct option is (B).
Note:
Here ${f_0}$ is representing threshold frequency which is the minimum frequency of incident radiation to dislodge an electron from an atom. This energy is completely consumed in the process of photoelectric emission. It depends on the nature of the material upon which incident radiation is striking irrespective of the intensity of incident light.
Recently Updated Pages
Master Class 12 Economics: Engaging Questions & Answers for Success
Master Class 12 Physics: Engaging Questions & Answers for Success
Master Class 12 English: Engaging Questions & Answers for Success
Master Class 12 Social Science: Engaging Questions & Answers for Success
Master Class 12 Maths: Engaging Questions & Answers for Success
Master Class 12 Business Studies: Engaging Questions & Answers for Success
Trending doubts
Which are the Top 10 Largest Countries of the World?
What are the major means of transport Explain each class 12 social science CBSE
Draw a labelled sketch of the human eye class 12 physics CBSE
Why cannot DNA pass through cell membranes class 12 biology CBSE
Differentiate between insitu conservation and exsitu class 12 biology CBSE
Draw a neat and well labeled diagram of TS of ovary class 12 biology CBSE