


For frugivorous birds and mammals of the tropical forests of different continents, the slope is found to be
a) 0.6
b) 1.3
c) 1.15
d) 1.7
Answer
537.6k+ views
Hint: Species area relationship is a curve that determines the relationship between the number of species found in that area and the area of habitat. This relationship was given by Alexander Von Humbolt, who observed that species increase with the increase in the area but only up to a certain limit.
Complete answer:
Alexander von Humboldt observed that within a region, species richness increased with increasing explored area, but only up to a limit. This meant that species increased with the increase in the area but only up to a certain limit.
This relationship curve for most of the species is a rectangular hyperbola. Such species with rectangular hyperbolic curves include angiosperm plants, birds, bats, and freshwater fishes. If a graph was plotted, the relationship is a straight line represented by the equation log S = log C + Z log A where, S is the species richness, A is the area of habitat, Z is the slope of the line (regression coefficient) and C is the Y-intercept.
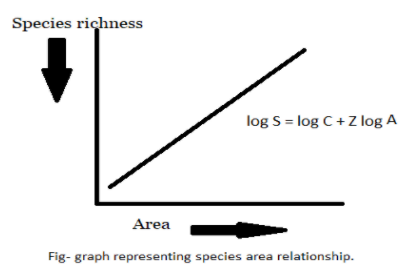
The slope of the line is much steeper and ranges between two. For birds and mammals residing in the tropical forests of different continents, belonging to the frugivorous category has a slope of 1.15.
Therefore, option c) is the correct answer.
Note:
The frugivorous animals and birds survive on raw fruits, succulent vegetables, roots and shoots, nuts and seeds. They generally belong to the tropical forests of different countries. To date, there is a record of twenty-one species of birds and nine species of animals (mammals) who are frugivorous.
Complete answer:
Alexander von Humboldt observed that within a region, species richness increased with increasing explored area, but only up to a limit. This meant that species increased with the increase in the area but only up to a certain limit.
This relationship curve for most of the species is a rectangular hyperbola. Such species with rectangular hyperbolic curves include angiosperm plants, birds, bats, and freshwater fishes. If a graph was plotted, the relationship is a straight line represented by the equation log S = log C + Z log A where, S is the species richness, A is the area of habitat, Z is the slope of the line (regression coefficient) and C is the Y-intercept.
The slope of the line is much steeper and ranges between two. For birds and mammals residing in the tropical forests of different continents, belonging to the frugivorous category has a slope of 1.15.
Therefore, option c) is the correct answer.
Note:
The frugivorous animals and birds survive on raw fruits, succulent vegetables, roots and shoots, nuts and seeds. They generally belong to the tropical forests of different countries. To date, there is a record of twenty-one species of birds and nine species of animals (mammals) who are frugivorous.
Recently Updated Pages
Three beakers labelled as A B and C each containing 25 mL of water were taken A small amount of NaOH anhydrous CuSO4 and NaCl were added to the beakers A B and C respectively It was observed that there was an increase in the temperature of the solutions contained in beakers A and B whereas in case of beaker C the temperature of the solution falls Which one of the following statements isarecorrect i In beakers A and B exothermic process has occurred ii In beakers A and B endothermic process has occurred iii In beaker C exothermic process has occurred iv In beaker C endothermic process has occurred
Master Class 12 Social Science: Engaging Questions & Answers for Success
Master Class 12 Physics: Engaging Questions & Answers for Success
Master Class 12 Maths: Engaging Questions & Answers for Success
Master Class 12 Economics: Engaging Questions & Answers for Success
Master Class 12 Chemistry: Engaging Questions & Answers for Success
Three beakers labelled as A B and C each containing 25 mL of water were taken A small amount of NaOH anhydrous CuSO4 and NaCl were added to the beakers A B and C respectively It was observed that there was an increase in the temperature of the solutions contained in beakers A and B whereas in case of beaker C the temperature of the solution falls Which one of the following statements isarecorrect i In beakers A and B exothermic process has occurred ii In beakers A and B endothermic process has occurred iii In beaker C exothermic process has occurred iv In beaker C endothermic process has occurred
Master Class 12 Social Science: Engaging Questions & Answers for Success
Master Class 12 Physics: Engaging Questions & Answers for Success
Trending doubts
Which are the Top 10 Largest Countries of the World?
Draw a labelled sketch of the human eye class 12 physics CBSE
Differentiate between homogeneous and heterogeneous class 12 chemistry CBSE
What are the major means of transport Explain each class 12 social science CBSE
Sulphuric acid is known as the king of acids State class 12 chemistry CBSE
Why should a magnesium ribbon be cleaned before burning class 12 chemistry CBSE