


How do you draw a graph of a relation that is not a function?
Answer
568.8k+ views
Hint: Here in this question, we have to plot a graph. Usually while plotting the graph, we plot x axis versus y- axis. But here in this question we have to draw a graph of a relation which is not a function. There are many answers possible, any graph in two variables is a relation, but only a function if it passes a vertical line test.
Complete step by step solution:
The graph is generally plotted x- axis versus y -axis. When we have two variables then we plot a two-dimensional graph. Here in this question, we have to draw a graph of a relation that is not a function. We can declare a relation a function if when we draw a vertical line with equation \[x = a\] on the coordinate plane, with any value of a i.e., a= 1, 2, 3, … , the line doesn't hit the graph of the function more than once .
Now consider an example \[x = 1\]. The relation means
-Suppose if we consider the value of y as 0 then the value of x is 1.
-Suppose if we consider the value of y as +1 then the value of x is 1.
-Suppose if we consider the value of y as -1 then the value of x is 1.
For any value of y either it is positive terms or the negative terms the value of x will be the same. The graph for the given equation \[x = 1\] is as shown below.
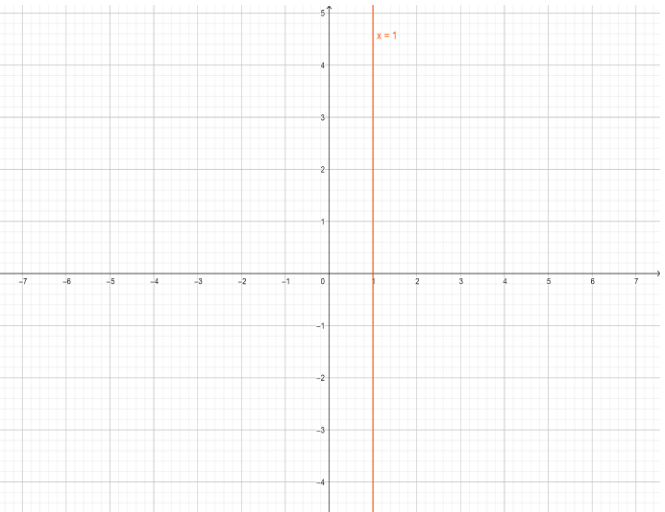
If we see the graph \[x = 1\] the vertical line is parallel to the y-axis. We don’t have a one dimensional graph, if the equation contains only one variable either its x or y we must know that for any value x or y the equation will be constant which is not a function.
Note: The graph is plotted against the two axes namely X-axis and Y-axis. If we know the value of one, we can find the other by using the equation of the graph. This graph is two dimensional because they have mentioned only two axes. The constant function can have graphs in the two dimensional way.
Complete step by step solution:
The graph is generally plotted x- axis versus y -axis. When we have two variables then we plot a two-dimensional graph. Here in this question, we have to draw a graph of a relation that is not a function. We can declare a relation a function if when we draw a vertical line with equation \[x = a\] on the coordinate plane, with any value of a i.e., a= 1, 2, 3, … , the line doesn't hit the graph of the function more than once .
Now consider an example \[x = 1\]. The relation means
-Suppose if we consider the value of y as 0 then the value of x is 1.
-Suppose if we consider the value of y as +1 then the value of x is 1.
-Suppose if we consider the value of y as -1 then the value of x is 1.
For any value of y either it is positive terms or the negative terms the value of x will be the same. The graph for the given equation \[x = 1\] is as shown below.
If we see the graph \[x = 1\] the vertical line is parallel to the y-axis. We don’t have a one dimensional graph, if the equation contains only one variable either its x or y we must know that for any value x or y the equation will be constant which is not a function.
Note: The graph is plotted against the two axes namely X-axis and Y-axis. If we know the value of one, we can find the other by using the equation of the graph. This graph is two dimensional because they have mentioned only two axes. The constant function can have graphs in the two dimensional way.
Recently Updated Pages
Master Class 12 Social Science: Engaging Questions & Answers for Success
Master Class 12 Physics: Engaging Questions & Answers for Success
Master Class 12 Maths: Engaging Questions & Answers for Success
Master Class 12 Economics: Engaging Questions & Answers for Success
Master Class 12 Chemistry: Engaging Questions & Answers for Success
Master Class 12 Business Studies: Engaging Questions & Answers for Success
Trending doubts
Which are the Top 10 Largest Countries of the World?
Draw a labelled sketch of the human eye class 12 physics CBSE
Explain the structure of megasporangium class 12 biology CBSE
What are the major means of transport Explain each class 12 social science CBSE
How many chromosomes are found in human ovum a 46 b class 12 biology CBSE
The diagram of the section of a maize grain is given class 12 biology CBSE