


Chapter-wise Class 4 Maths Questions and Answers Free PDF Download
Class 4 students who are preparing for Maths can now use NCERT solutions for their exam preparations. The Maths Class 4 study material provided by NCERT solutions is the best source of information as they are developed by subject experts in Mathematics. This is why NCERT solutions for 4th Class Maths are highly used by students, as they are accurate as well as reliable. With the help of infographics, figures and diagrams, definitions, and questions and answers, the NCERT solutions make learning simple and quick. NCERT solutions for class 4th maths are also available in the form of a free PDF download which is accessible freely across the country for every student.
 Table of Content
NCERT Solutions for Class 4 Maths | Chapter-wise List
Given below are the chapter-wise NCERT Solutions for Class 4th Maths. These solutions are provided by the Maths experts at Vedantu in a detailed manner. Go through these chapter-wise solutions to be thoroughly familiar with the concepts.
Glance on NCERT Solutions Class 4 Maths
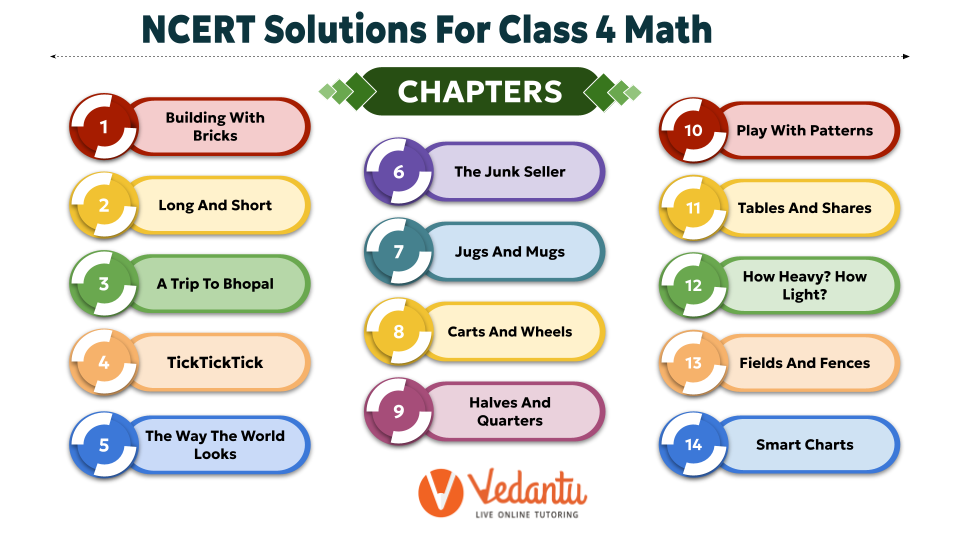
NCERT Solutions for Class 4 Maths for all the chapters from Chapters 1 to 14 are provided.
Practising the textbook questions using these solutions can help students good foundation of concepts.
Covering chapters like: Building With Bricks, Long And Short, A Trip To Bhopal, TickTickTick, The Way The World Looks and more.
This article also provides resources such as NCERT notes, important questions, sample papers PDF for further reference.

FAQs on NCERT Solutions For Class 4 Maths - 2026-27
1. Why are Solutions NCERT 4th Class Maths important for students?
By using the NCERT Solutions for 4th Class Maths, students will be able to develop a strong mathematical foundation of the concepts. This will help them with the much-advanced concepts that they will be learning in their higher classes. They can also use these solutions for cross-checking their answers. With these Solutions NCERT 4th Class Maths, they will have better time management and will be able to finish their syllabus well before their exam.
2. How can CBSE students use Maths for Solutions NCERT 4th Class Maths effectively?
If you want to make the most out of these Solutions NCERT 4th Class Maths, you must first have an in-depth understanding of the theoretical concepts. Next, you should try solving the problems given in the NCERT textbook without consulting the solutions. After that, you can check your answers by referring to these solutions. You should analyze the steps used for getting the answer as each step has marks.
3. Do you have to practice all the questions given in the NCERT Solutions for Maths for Class 4?
Yes, it is important that you solve all the questions that are provided in the NCERT Solutions for 4th Class Maths. Math is a subject for which you need regular practice. Every question that you solve will improve your understanding of the concept better which will not only help you score well in your exam but also in your higher classes.
4. Should you make notes while studying from the NCERT Solutions for 4th Class Maths?
When you are working with 4th Class Maths NCERT Solutions, it is important that you make notes. By writing down important points, formulae, and tricks related to a topic, you will be able to recall them faster. It will also help you comprehend the solutions more effectively.
5. How can Solutions NCERT 4th Class Maths help promote problem-solving abilities?
With Vedantu’s Solutions NCERT 4th Class Maths, you will get a step-by-step explanation of all the questions. As all the questions are broken down into smaller parts, you will be able to study them in an organized manner. It will help you learn how to approach a problem with a problem-solving and critical thinking mindset. You can apply these skills to other subjects as well.
6. What is the best way of learning the concepts given in the NCERT Solutions for 4th Class Maths?
If you want to learn the concepts given in the NCERT Solutions for 4th Class Maths in the best way, you should start by getting a thorough understanding of the concepts followed by continuous revision and regular practice. It is normal to get some doubts while attempting a question. You can refer to these solutions as soon as you encounter a doubt to ensure that you don’t have any gap in your learning. Also, there are some tips and tricks given in these solutions that will help you solve problems faster.
7. Where can I get chapter-wise NCERT Solutions for Maths for Class 4?
You can get chapter-wise NCERT Solutions for 4th Class Maths through the links given above. All the solutions are available in pdf format and are compatible with mobile screens as well. You can download these solutions for free from the official website of Vedantu or through the Vedantu app.
8. What is BODMAS?
The concept of BODMAS is generally introduced in Class 4 for Maths students. According to BODMAS, long equations can be solved following an order. The letter “B” stands for brackets, “O” for of, “D” for division, “M” for multiplication, “A” for additions, and “S” for subtraction.
This rule implied that mathematical equations should be solved in the order for solving brackets first then division which is then proceeded by multiplication and then addition and subtraction. If this order is not followed, generally the answer to the equation is calculated wrong. Therefore, following the rule of BODMAS can lead to the right answer.
9. What are the types of fractions?
Fractions are also a new concept for Class 4 students studying the subject of Mathematics. As a new chapter, the concept of fractions is initially introduced to students. A fraction is a mathematical concept that consists of a numerator and a denominator. There are also different types of fractions that students will learn in this new chapter. Some of the common types of fractions are a proper fraction, improper fraction, and mixed fraction. Students can learn more about fractions through the NCERT solutions for Maths for Class 4 for CBSE that are available on their website as well as the mobile application.
10. What is algebra in class 4?
In class 4, algebra is introduced in a very basic form. It involves recognizing and using simple patterns and relationships between numbers. Students might learn to solve basic equations involving an unknown variable (often represented by symbols like boxes or letters) in very simple contexts.
11. What is time in maths for class 4?
Time in maths for class 4 covers understanding and reading clocks (both analogue and digital), calculating time intervals, and understanding concepts such as hours, minutes, and seconds.
12. How do I prepare for 4th grade Math?
To prepare for 4th grade maths, students should:
Review basic arithmetic operations (addition, subtraction, multiplication, and division).
Practice reading and writing large numbers.
Get comfortable with basic geometric shapes and their properties.
Work on simple measurements and conversions (length, weight, and volume).
Utilize online resources by Vedantu designed for 4th grade maths practice.
13. What to expect in 4th grade Math?
In 4th grade maths, students can expect to:
Deepen their understanding of addition, subtraction, multiplication, and division.
Learn about factors and multiples.
Explore basic fractions and decimals.
Study more complex geometric shapes and their properties.
Work on measurement concepts, including perimeter, area, and volume.
Handle simple data interpretation and graphing.