


An Overview of Cbse Class 4 Maths Notes Chapter 14 Smart Charts
Smart Charts
A smart chart is a collection of information. This information is collected by observations and measurements.
Smart charts can involve tables, bar graphs (both horizontal and vertical) etc.
Smart charts are used to make data more presentable, visually appealing and easy and quick to understand.
Example: The following table shows the number of students who want to go to a picnic and those who don’t want to go to a picnic
Tables
Tables are made up of cells that are arranged in rows and columns.
There are no restrictions on the number of rows and columns a table can have.
Columns involve vertical grouping whereas rows involve horizontal grouping.
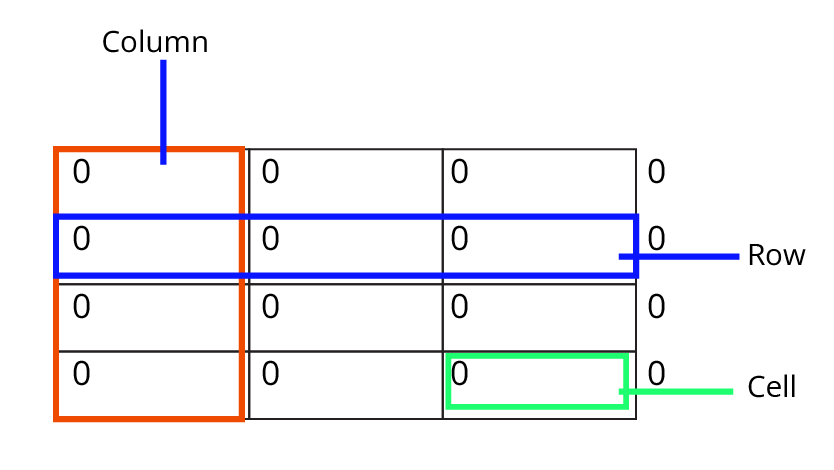
A smart chart showing columns, rows and cells
They can be used to create lists, compare data, align and group data, and so on.
They are used to organise data that is too complicated to be adequately described in the text, allowing the reader to see the results quickly.
Example: The following table shows the number of kids and their respective no of hours of TV.
Table helps us in easily analysing information and getting results from it.
Example: We can easily tell from the above table that four kids watch TV for one hour.
Solved Example 1. From the above table can you tell the number of kids who watch TV for more than four hours?
Ans: Clearly, from row one we can see that two kids watch TV for more than four hours.
Extracting Data From the Table
Sometimes we are not given exact numbers directly in the table and we need to extract information from it.
Let's understand this through an example.
Solved Example 1. Nikki made a list of her close friends and the video games they like and don’t like.
Observe the above data and answer the following questions.
Q. Which video game is liked by most of Nikki’s friends?
Ans. Observe that Super Mario appears two times in the second column. Rest all games appear only once. Hence, Super Mario is the most liked game by Nikki’s friends.
Q. Which video game is not liked by most of Nikki's friends?
Ans. Observe that Temple Run appears two times in the third column. Rest all games appear only once. Hence, Temple Run is not liked by most of Nikki’s friends.
Practical Applications of Table
Daily attendance record is maintained in a table.
School mark sheets are in form of a table.
Your school exam timetable/ daily class timetable also uses a table.
How to Make a Table?
Step 1: Collect data for the table.
Step 2: Select the method of grouping.
Step 3: Draw the table.
Let’s understand this with the help of an example.
Solved Example 1. In a class, 25 kids love to drink milk, 10 kids love to drink coffee and 5 kids love to drink tea. Represent data in a table.
Hint: Make two columns, one for the number of kids and another for the drink they like.
Ans:
Step 1: Data is already collected and given in the question.
Step 2: We will make two columns one for the number of kids and another for the drink they like.
Step 3: Let’s draw the table:
What is a Chart?
A chart is a graphical representation of data.
Data can be represented by symbols, such as bars in a bar chart.
The length of bars in a bar chart is proportional to their values.
Bar charts can be horizontal or vertical. (if bars are vertical we call it a vertical bar chart and if bars are horizontal then we call it a horizontal bar chart)
Drawing a Chart
Step 1: Collect the data.
Step 2: Choose the type of chart.
Step 3: Choose an axis.
Step 4: Draw the chart.
Let’s understand this through an example:
Given that 5 kids like Oranges, 2 kids like Apples, 6 kids like Bananas, and 3 kids like Kiwi.
Let’s make a vertical bar chart for this.
Let the horizontal axis represent the type of fruit and the vertical axis represent the number of kids.
We get the following graph.
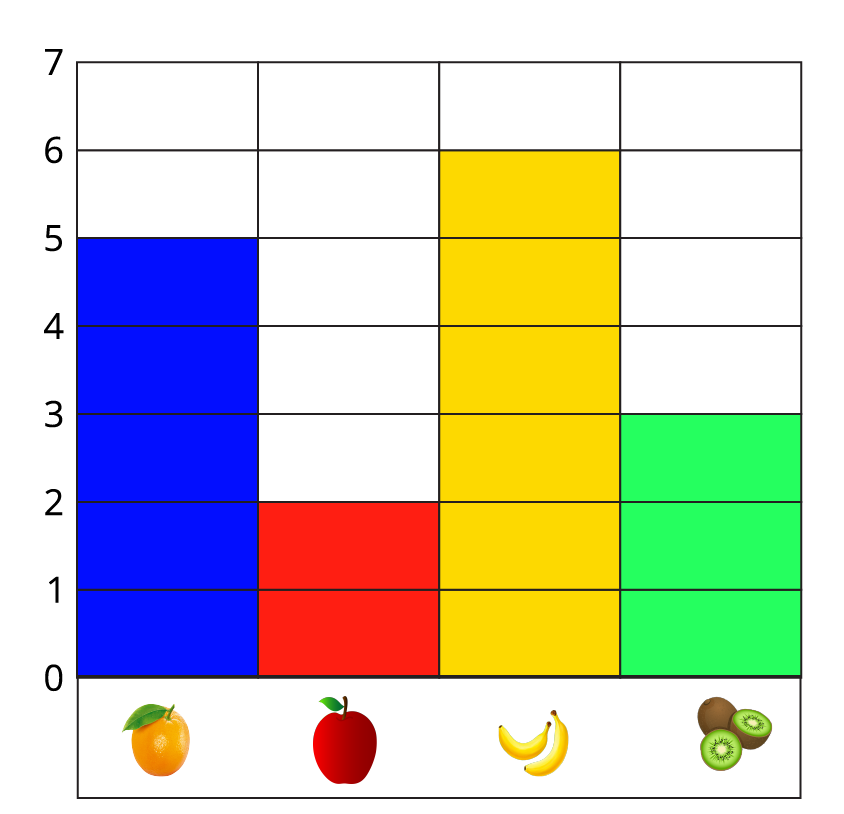
A Smart chart with a horizontal axis representing the type of fruit and a vertical axis representing the number of kids
Horizontal Bar Chart
Sometimes instead of making vertical bars we make horizontal bars also. Such a graph we call a Horizontal bar graph.
Example following bar graph shows the number of frog homes present in trees, gardens and ponds.
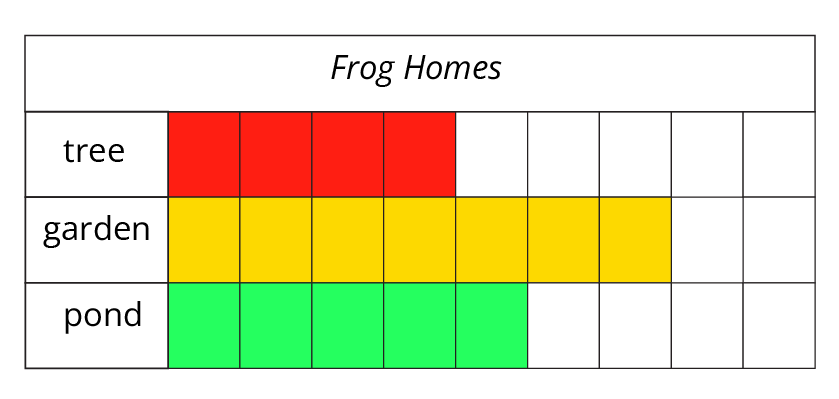
A smart chart showing the number of frog homes present in trees, gardens and ponds
Reading the Chart
We can read data by observing the length of bars.
In the above graph, seven frogs live in the garden as seven green boxes are present.
Similarly, we can find the number of frogs living in the tree and pond as four and five respectively.
Practice Questions:
Q1. The following bar chart shows the number of children who like a particular fruit. Can you tell which fruit is liked most by children and which is liked least by children?
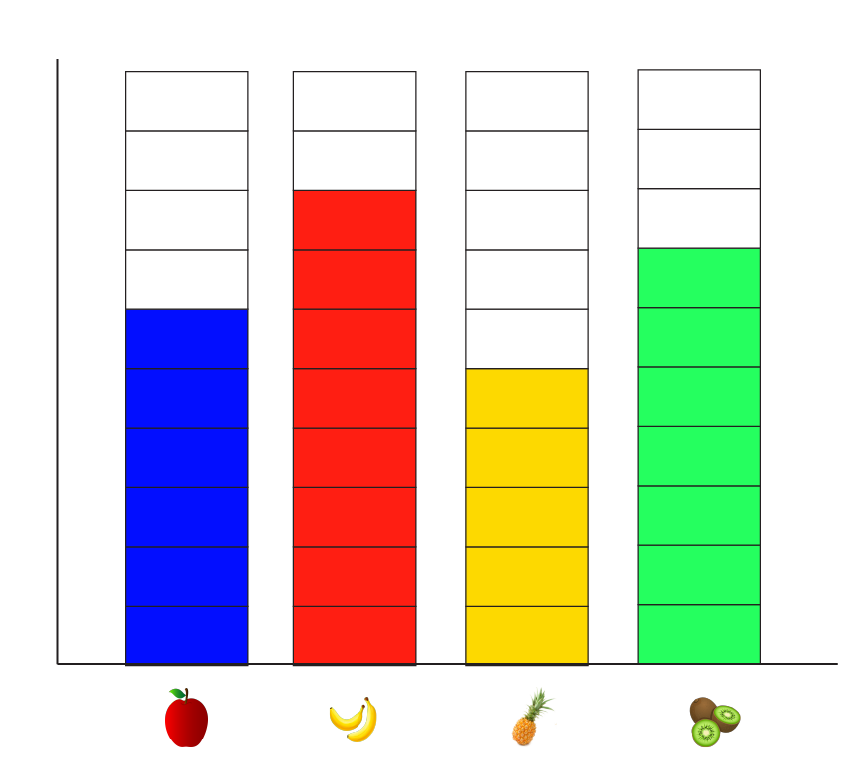
A bar chart with particular fruit liked by the number of children
Answers.
Ans: Most liked fruit: Banana
Least liked fruit: Pineapple
Q 2. The following table shows the number of children who liked a particular sport. Can you tell how many children like Football? Also, tell whether it is the most liked sport or not.
Ans: 10 children play football. No, it’s not the most liked sport.
Importance of CBSE Class 4 Maths Chapter 14 Smart Charts Revision Notes
The importance of the revision notes of this chapter can be understood from the list mentioned below.
The introduction of statistics at the basic level shows how to extract information from a given text. Students will learn what is smart chart and how to formulate one from scratch.
They will understand the meaning of rows and columns. Previously, they have input data in the tabs that have already been designed. Now, they will figure out how to formulate a chart from scratch using the specific information provided.
They will learn to follow the questions and then proceed to make a smart chart.
Identifying a particular type of information from the text such as objects, colours, features, time, events, etc., will become a strong point for Class 4 students.
Handling multiple rows and columns to solve a sum will become a lot easier by referring to these revision notes. Students will be able to make charts related to flowers and different colours and give the correct information according to the questions asked.
Benefits of Smart Charts Class 4 Worksheets and Revision Notes
Explore the advantages of Smart Charts Class 4 Worksheets and Revision Notes! These resources enhance understanding and retention, providing a structured and effective way for students to reinforce their learning on the topic.
Our subject experts understand the prime objective of this chapter. Its inclusion in the syllabus has led to the foundation concept of creating charts among students. It will be useful for students in the future for understanding statistical methods and principles of probability.
Answering questions like what do we see on the road, especially information, will become easier when our subject experts explain how to extract information from a provided text.
These revision notes will also help you to resolve your doubts and give you proper ideas and methods to solve the Maths exercise for Class 4 Chapter 14.
You can also solve the worksheets from this chapter on your own. The solutions are also provided for checking the problem-solving methods adopted by the subject experts.
Make Smart Charts Easier to Prepare
Math Magic Class 4 Chapter 14 has never been easier to study. Comprehend the topics and concepts explained in this chapter using the revision notes and worksheets. Practice and prepare this chapter by referring to the revision notes before an exam and score well.
Conclusion
Dive into the adventure of understanding Smart Charts with Vedantu's NCERT notes for Class 4 Maths Chapter 14. These notes, created by expert educators, simplify the Smart Charts topic, making it easy to learn and handle questions, even at the last minute. By immersing yourself in these notes, you not only prepare for your studies more efficiently but also gain a deep understanding of Smart Charts. This chapter introduces you to a captivating world of data representation, where you'll learn to read and create different types of charts, making learning about data handling fun and colourful for Class 4 students.
Related Study Materials for Class 4 Maths Chapter 14
CBSE Class Chapter-wise Class 4 Maths Revision Notes
Related Study Material Links for Class 4 Maths
FAQs on CBSE Notes Class 4 Maths Chapter 14 - Smart Charts - 2026-27
1. How can I use smart charts?
From the Smart Charts summary, you can realize that this technique can be used to extract information from a lot of data. You can tabulate information and solve questions based on them.
2. What are rows and columns in a chart?
Rows are the sections that run from left to right drawn on your Maths Exercise chart. Columns are those that run from top to bottom of a page on the same chart. Rows and columns intersect each other to form a chart.
3. How can I practice NCERT Class 4 Maths Exercises Chapter 14?
Download the NCERT Solutions for Class 4 Maths Chapter 14 to get a clear understanding of the types of sums covered and their solutions. Solve and practice the sums on your own and compare your answers with the given solutions to check your answers.
4. What is the purpose of learning about Smart Charts in Class 4 Maths?
Understanding Smart Charts in Class 4 Maths is crucial as it teaches students how to visually represent data using charts like bar graphs and pictographs. This skill helps in organizing information, making it easier to analyze and draw conclusions from different sets of data.
5. How can I improve my skills in interpreting Smart Charts?
To enhance your Smart Charts interpretation skills, practice creating various charts using different data sets. Additionally, focus on understanding the key elements of charts, such as axes, labels, and legends. Regularly working with Smart Charts will build your confidence and proficiency in interpreting visual data representations.
4. What is the significance of learning about Smart Charts in Class 4 Maths?
Understanding Smart Charts in Class 4 Maths is crucial as it teaches you how to visually represent information using graphs and charts. This skill is valuable in daily life for organizing and interpreting data. Learning Smart Charts lays the foundation for effective data handling, enhancing your ability to make sense of information in a fun and colorful way.
5. How can I use Smart Charts in real life, and why is it important?
Smart Charts are helpful in real life for organizing and presenting information in a visual and easily understandable way. For example, you can create a chart to represent your toy collection or track your daily reading habits. Understanding Smart Charts is important as it equips you with practical skills for managing information effectively in various situations.