


Activity and Profitability Ratio: An Introduction
Activity ratios measure how efficiently a company operates. This is commonly known as the "Assets Management Ratio," or how well management uses the company's assets to generate as much income as possible. This ratio typically displays the number of sales of particular asset categories.
Profitability ratios are financial indicators that help measure and analyse a company's ability to profit. These talents can also be evaluated over time using the income statement, balance sheet, shareholder's equity, or sales processes. The profitability ratio formula also demonstrates how efficiently a company uses its resources to generate profits and provide value for its shareholders.
What is the Activity Ratio?
Activity ratios assess a company's operating efficiency by examining fixed assets, inventories, and accounts receivable. It describes a company's financial health and demonstrates how the balance sheet's elements are used. Activity ratios are financial ratios that a company uses to determine how effectively it can use the various operating assets listed on its balance sheet to generate revenue or cash. The activity ratio is also known as the efficiency and the more well-known turnover ratio.
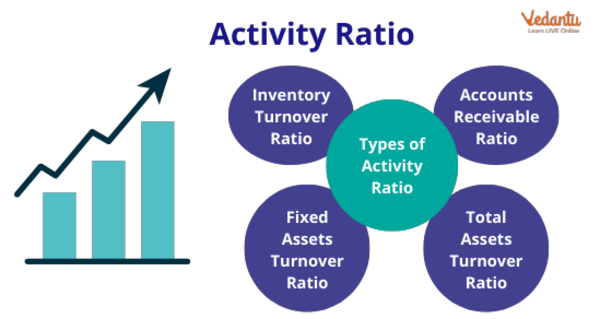
Activity Ratio
What is the Profitability Ratio?
Analysts and investors use profitability ratios to measure and evaluate a company's ability to generate money (profit) from sales, balance sheet assets, operating costs, and shareholders' equity over a given period. They show how effectively a company uses its resources to generate profit and shareholder value.
Most businesses strive for a higher ratio or value because doing so typically indicates that the company is profitable and producing cash flow. The ratios are most useful compared to other companies in the same industry or earlier periods.
Profitability Ratios
Activity Ratio Types with Formula
Different activity ratios may be used to make decisions depending on the type of business. Using examples and calculations, let's look at activity ratio types with the activity ratios formula.
Inventory Turnover Ratio
This activity ratio formula displays the number of times an inventory-holding company's stock has been entirely depleted within a single accounting period.
Inventory Turnover Ratio = Cost of Goods Sold / Average Cost of Inventory.
Total Assets Turnover Ratio
The net sales of total assets are calculated using the total assets turnover ratio. In other words, it shows how well a company can make money. It aids investors in comprehending how well businesses use their assets to generate money.
Total Assets Turnover Ratio = Sales / Average Total Assets.
Profitability Ratio Types with Formula
Profitability ratios show a company's ability to create profits from its operations.
Let us discuss the various profitability ratio types using the profitability ratios formula.
Gross Profit Ratio
The gross profit ratio is a profitability measure that evaluates the relationship between gross profit and net sales revenue. It is also known as the Gross Profit Margin when expressed as a percentage.
Gross Profit Ratio = Gross Profit/Net Revenue of Operations × 100
Operation Ratio
An operating ratio calculates the cost of operations to the income generated by operations.
Operating Ratio = (Cost of Revenue from Operations + Operating Expenses)/ Net Revenue from Operations ×100
Solved Question
Q. How has the profitability ratio been interpreted? Explain with examples.
Ans. Every company wishes to be profitable. A higher gross margin indicates that a company either charges premium prices for its products or has low direct costs, positioning it advantageously in the market. As a shareholder, you must also evaluate the profitability ratios to assess the company's financial success. In contrast, a lower gross margin can indicate bad pricing or high direct costs. However, the company's product mix may evolve, resulting in a lower gross margin.
Despite a poor operating margin and a favourable gross margin, the corporation spends too much on fixed costs. Increased rents, higher employee salaries, and so on.
Conclusion
The activity ratio, which measures how quickly assets can be converted into cash or sales, can be used to forecast a company's performance. Management and accounting departments can evaluate their effectiveness using a variety of activity ratios. The two most common ratios are inventory turnover and total asset turnover. It is common practice to analyse and compare ratios with other companies in the industry.
FAQs on Activity and Profitability Ratios: Key Differences
1. What is the primary difference between Activity Ratios and Profitability Ratios?
The primary difference lies in what they measure. Activity Ratios, also known as Turnover or Efficiency Ratios, assess how efficiently a company uses its assets (like inventory or accounts receivable) to generate sales. In contrast, Profitability Ratios evaluate a company's ability to generate earnings relative to its revenue, operating costs, assets, and equity. Essentially, Activity Ratios focus on operational efficiency, while Profitability Ratios focus on financial returns and performance.
2. What are the key types of Profitability Ratios used in financial analysis?
The key types of Profitability Ratios measure profit at different stages. The main ones include:
- Gross Profit Ratio: Measures profitability after accounting for the cost of goods sold.
- Operating Profit Ratio: Shows the profit earned from core business operations before interest and tax.
- Net Profit Ratio: Indicates the final profit available to shareholders after all expenses, including taxes and interest, are deducted.
- Return on Investment (ROI): Measures the overall profitability of the business by comparing net profit to the total capital employed.
3. What are the main formulas for calculating common Activity Ratios?
Common Activity Ratios are calculated to measure operational efficiency. The main formulas are:
- Inventory Turnover Ratio = Cost of Revenue from Operations / Average Inventory
- Trade Receivables Turnover Ratio = Credit Revenue from Operations / Average Trade Receivables
- Trade Payables Turnover Ratio = Net Credit Purchases / Average Trade Payables
- Working Capital Turnover Ratio = Revenue from Operations / Working Capital
4. What do high or low Profitability Ratios indicate about a company?
A high profitability ratio generally indicates that a company is performing well. It suggests efficient management, strong pricing strategies, and effective cost control, leading to healthy returns. Conversely, a low profitability ratio can be a red flag, suggesting issues like high operating costs, weak pricing power, or inefficient management. However, these ratios should always be compared with industry benchmarks and previous periods for a meaningful analysis.
5. Can you provide a real-world example of how an Activity Ratio is used?
Certainly. Consider a retail company. By calculating its Inventory Turnover Ratio, the management can see how quickly its stock is being sold and replaced over a period. A high ratio indicates strong sales and efficient inventory management. If the ratio is low, it might suggest that the company is overstocking, holding obsolete inventory, or facing poor sales, which ties up cash and increases storage costs.
6. How do Activity and Profitability Ratios work together to give a complete picture of a company's health?
These two ratio types provide a synergistic view. A company might have a high Profitability Ratio (e.g., Net Profit Margin) but a low Activity Ratio (e.g., Inventory Turnover). This combination suggests that while each sale is very profitable, the company is not selling its products quickly enough. This could lead to cash flow problems or risk of inventory becoming obsolete. Analysing them together helps determine if a company's operational efficiency is effectively translating into sustainable profits.
7. If a company has high profitability but low activity ratios, what might that suggest?
This scenario often points to a business model focused on high-margin, low-volume products, such as luxury goods or specialised equipment. While each sale is highly profitable (high profitability ratio), the assets used to generate those sales (like inventory) are not turned over quickly (low activity ratio). While this can be a valid strategy, it may also indicate potential risks like inefficient asset utilisation, high carrying costs for inventory, or slow collection of receivables, which could impact liquidity.
8. Are Activity Ratios and Efficiency Ratios the same thing?
Yes, the terms Activity Ratios and Efficiency Ratios are often used interchangeably. Both categories of ratios are designed to measure how effectively a company utilises its assets and manages its liabilities to generate revenue. They provide insights into the operational side of the business, such as how quickly inventory is sold, receivables are collected, and payables are settled.
9. How are Activity Ratios fundamentally different from Solvency Ratios?
The fundamental difference is their focus on time horizon and financial stability. Activity Ratios measure short-term operational efficiency—how well a company uses its assets to generate sales in its day-to-day operations. In contrast, Solvency Ratios measure a company's long-term financial health and its ability to meet its long-term debt obligations. While Activity Ratios look at operational speed, Solvency Ratios (like the Debt-to-Equity Ratio) assess long-term survival and risk.
10. Why is it important to compare a company's ratios with industry averages?
Comparing ratios with industry averages provides crucial context. A ratio that seems 'good' or 'bad' in isolation might be normal for its specific industry. For example, a supermarket (high volume) will naturally have a much higher Inventory Turnover Ratio than a car dealership (low volume, high value). This comparison helps analysts and investors to:
- Identify whether the company is an outperformer or underperformer relative to its competitors.
- Understand industry-specific operational and financial structures.
- Make more informed judgements about the company's true performance and potential.