


Determination of Income and Employment Class 12 important questions with answers PDF download
Free PDF download of Important Questions with Answers for CBSE Class 12 Macro Economics Chapter 4 - Determination of Income and Employment prepared by expert Economics teachers from latest edition of CBSE(NCERT) books. Register for Online tuition on Vedantu.com to score more marks in CBSE board examination.
 Table of Content

Very Short Answer Questions (1 Mark)
1. In a two sector economy Aggregate Demand equals
a) Consumption + Private consumption expenditure
b) Consumption + Exports
c) Consumption + Investments
d) Consumption + Government Expenditure
Ans: (c) Consumption + Investment
2. APS=
a) $\dfrac{\mathrm{S}}{\mathrm{Y}}$
b) None of the these
c) $\dfrac{\mathrm{S}}{\mathrm{D}}$
d) $\dfrac{\mathrm{C}}{\mathrm{S}}$
Ans: (a) $\dfrac{\mathrm{S}}{\mathrm{Y}}$
3. APC + APS should always be equal to 1
a) False
b) Depends on their values
c) None of these
d) True
Ans: (d) True
4. Consumption changes in the same direction as income. It is
a) True
b) False
c) Can’t say
d) Insufficient information
Ans: (a) True
5. The law of Psychological consumption states
a) Consumption does not change in the same direction as income
b) Consumption changes in the same direction as investment
c) Consumption changes in the opposite direction as income
d) Consumption changes in the same direction as income but APC remains less than unity
Ans: (d) Consumption changes in the same direction as income but APC remains less than unity
6. What is the relation between APC and APS?
Ans: The relation between Average Propensity to Consume (APC) and Average Propensity to Save (APS) is always equal to 1 (unity), that is,
APC + APS = 1
This is because the money income can either be spent on consumption or saved.
7. State the important factor influencing the propensity to consume in an economy.
Ans: It is always the level of income (Y) that impacts an economy's propensity to consume (C).
8. Give the formula of investment multiplier in terms of MPC.
Ans: The formula of investment multiplier in terms of MPC is shown below.
$\Rightarrow K = \dfrac{1} {1-MPC}$
9. Write down the equation of saving function.
Ans: The equation of saving function is given below.
$S\text{ }=\text{ }-a\text{ }+\text{ }\left( 1\text{ }-\text{ }b \right)\text{ }y$
Here,
1-b = MPS
Y= Income
-a = Savings, when Y is 0
10. What is equilibrium income?
Ans: The amount of income at which aggregate demand equals aggregate supply is referred to as the equilibrium income. That is when AD=AS, there is equilibrium income.
11. MPS = 1 + MPC. It is
a) Depends on their values
b) True.
c) None of these
d) False
Ans: (d) False
12. C = a + bY is a
a) Algebraic function of the level of Investment expenditure
b) Linear function of the level of Consumption expenditure
c) Algebraic function of the level of Consumption expenditure
d) Algebraic function of the level of capital expenditure
Ans: (c) Algebraic function of the level of Consumption expenditure
13. The investment demand function is
a) The relationship between investment demand and the National income
b) The relationship between investment demand and the disposable income
c) The relationship between investment demand and the rate of interest
d) The relationship between investment demand and the consumption expenditure
Ans: (c) The relationship between investment demand and the rate of interest
14. The level of equilibrium income is determined by
a) AD and national income
b) AD and Investment
c) AD and Consumption
d) AD and AS
Ans: (d) AD and AS
15. Multiplier tells us what will be the
a) Change in investment results in the change in income
b) Final change in the income, as a result of change in consumption
c) Final change in the consumption, as a result of change in investment
d) Final change in the income, as a result of change in investment
Ans: (d) Final change in the income, as a result of change in investment
Short Answer Questions (3 or 4 Marks)
16. Explain the components of S = -a + (1-b)Y
Ans: The equation of saving function is
S = -a + (1-b)Y
In this equation, -a indicates the intercept term and the amount of savings made while there is no income. Savings are negative at zero since income consumption ‘a’ is positive. Negative saving is also known as dissaving, which means that at the 0 level, there is dissaving of the amount represented by -a
The slope of the saving function is measured by the coefficient 1-b. The slope of the saving function indicates the amount of money saved for every unit increase in income. This is referred to as the Marginal Propensity to Save. Since b,' or Marginal Propensity to Consume, is smaller than one, 1-b i.e. MPS, is positive. And Y refers to income here.
17. Can the average propensity to consume be greater than one? Give the reason for your answer.
Ans: When consumption surpasses income, the average propensity to consume can be greater than one. Also, APS is negative at this level, so APC will be more than one.
For example, if income is Rs. 1000, consumption is Rs. 1200, then,
$\begin{aligned}\mathrm{APC} &=\dfrac{1200}{1000} \\&=1.20\end{aligned}$
18. Differentiate between ex ante and ex post investment.
Ans: The difference between ex ante and ex post investment.
19. Explain the working of a multiplier with an example.
Ans: The multiplier shows us what the eventual change in income will be as a result of a change in investment. Changes in investment lead to changes in income. It is represented symbolically by:
$\Delta I\text{ }\to \text{ }\Delta Y\text{ }\to \text{ }\Delta C\text{ }\to \text{ }\Delta Y$
The operation of a multiplier can be illustrated using the table below, which is based on consumption, that is, $\Delta K = 1000 $ and $MPC = \dfrac{4}{5}.$
The process of income generation is shown below.
According to the above table, as $\text{MPC = }\dfrac{4}{5},$ the initial increase in investment of Rs 1000 results in a total increase in income of Rs 5000. From the whole increase in income, Rs. 4000 will be spent and Rs. 5000 will be saved.
The derivation of the sum of total increase in income is shown below.
$ =1000+\dfrac{4}{5} \times 1000\left(\dfrac{4}{5}\right)^{2} \times 1000\left(\dfrac{4}{5}\right)^{3} \times 1000+\ldots \ldots \ldots \infty $
$=1000\left[1+\dfrac{4}{5}+\left(\dfrac{4}{5}\right)^{2}+\left(\dfrac{4}{5}\right)^{3}+\ldots \ldots . \infty\right] $
$=1000 [\dfrac{1} {1} - \dfrac {4} {5}] $
$=1000 \times \dfrac {5} {1} $
$=\text { Rs. } 5000 \text { crores. }$
20. Can the value of APS be negative? If yes, then when?
Ans: Yes, when the value of spending/ consumption exceeds the value of income, the average propensity to save might be negative. Though APS can never be greater than one, as a person cannot save more than his income.
For example: Assume that the income is Rs. 1000 and its consumption expenditure is Rs. 1200.
Y= C-S
S= C-Y
S= 1000-1200
S= -200
$ \text{APS = }\dfrac{S}{Y} $
$ \text{APS = }\dfrac{-200}{1000} $
APS = -0.2
Long Answer Questions (6 Marks)
21. Define and represent the inflationary gap on a diagram. Explain the role of the varying reserves requirement in removing the gap.
Ans: Meaning: Inflationary Gap
An inflationary gap is a macroeconomic concept that defines the difference between the current level of real GDP and the expected GDP that would be experienced if an economy is at full employment, also known as the potential GDP.
An inflationary gap is always associated with a business-cycle expansion and occurs when an economy's equilibrium level of aggregate output exceeds the output that could be produced at full employment.
It also depicts the excess of aggregate demand over aggregate supply even when there is full utilization of the factors.
Formula
AD= C + I + G + (X-M)
That is, Consumption spending (C), investment expenditure (I), government expenditure (G), and the trade balance, or the value of exports minus the value of imports (X – M), comprise aggregate demand. Thus, the inflationary gap is the product of excess demand.
Diagram
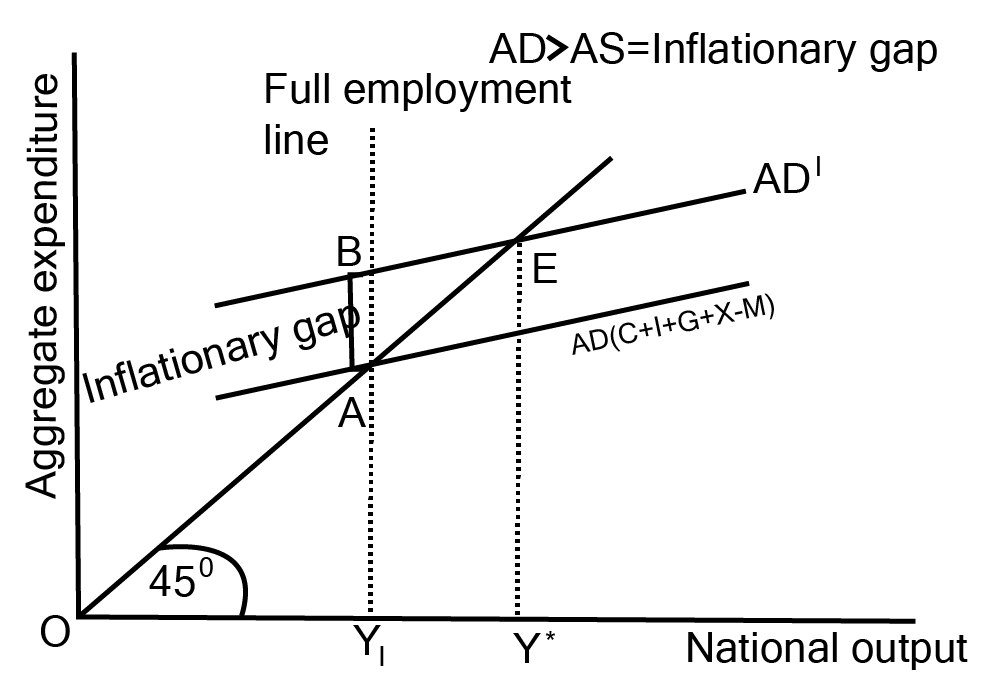
Explanation:
In the diagram:
AD curve represents the Aggregate demand at full employment.
AD’ curve represents the Aggregate demand beyond the full employment.
Point A is the equilibrium, where AD=AS (the 45° line is the AS or Y curve).
Vertical area AB depicts inflationary gap, as here at point E, the aggregate demand BY1 is greater than Aggregate Supply AY1.
OY1 is the full employment level of output.
As the output could not be increased beyond the full employment level, prices will rise, and there will be a situation of inflation in the economy.
The following things can be useful in order to remove the gaps given below.
Cash Reserve Ratio: The Cash Reserve Ratio (CRR) is the specified minimum fraction of total customer deposits that commercial banks must retain as reserves in cash or as deposits with the central bank.
To curb inflationary gap, RBI decides to raise the Cash Reserve Ratio, due to which the quantity of money accessible to banks decreases,and the commercial bank’s capacity to provide credit also falls. Hence the aggregate demand falls down with a low credit creation and supply of money in the economy.
Statutory Liquidity Ratio: Statutory liquidity ratio (SLR) is the term used by the Indian government to describe the reserve requirement that commercial banks in India are required to hold in the form of cash, gold reserves, and government-approved securities before extending credit to consumers.
To curb inflationary gap, RBI decides to raise the SLR, due to which the quantity of money accessible to banks decreases, and the commercial bank’s capacity to provide credit also falls. Hence the aggregate demand falls down with a low credit creation and supply of money in the economy.
22. In an economy C = 300 + 0.5Y and I = Rs. 600 (where C is consumption, Y is income or investment). Calculate the following:
a. Equilibrium level of income
Ans: Given:
C = 300 + 0.5Y
I = Rs. 600.
The equilibrium level of income is calculated as
$Y =C+I $
$ Y =300+0.5 Y+600 $
$ Y =\dfrac{900}{0.5} $
$ Y = 900 + 0.5 Y$
$0.5 Y = 900$
$Y= \dfrac {900} {0.5}$
Y= Rs 1800
b. Consumption expenditure at equilibrium level of income.
Ans: The consumption expenditure at equilibrium level of income is calculated as
Y= C+I
1800 = C +600
1800-600= C
1200= C
23. If in an economy investment increases by Rs. 1000 lakhs to Rs. 1200 lakhs and as a result, total income raises by 800 lakhs, calculate MPS.
Ans: In this case, MPS would be
$\Delta I =1200-1000 $
$=200 $
$\Delta Y= 800 $
$\Delta K = \dfrac {\Delta Y }{ \Delta I} $
$= \dfrac {800} {200} $
$=4 $
$\Delta K =\dfrac{1}{MPS}$
$\ 4=\dfrac{1}{MPS}$
$ MPS = \dfrac{1} {4} $
$=0.25$
Therefore, the value of MPS is $0.25 .$
24. Explain the role of the following in correcting deficient demand in an economy.
a. Open market operations
Ans: Open market activity refers to the central bank's sale and purchase of government and other sanctioned securities to commercial banks and other financial institutions. When the economy's cash balance has to be boosted, especially when demand is low, the central bank purchases a range of assets. This improves commercial banks' cash holdings, allowing them to make more loans and advances. As a result, overall demand rises.
b. Bank rate
Ans: The interest rate at which the central bank lends to commercial banks is known as the bank rate. The central bank lowers the bank rate to address the condition of inadequate demand. Commercial banks cut their market interest rates as a result of the central bank's reduction in the bank rate. Consumers and investors will benefit from lower commercial bank borrowing costs. This increases loan demand, resulting in more liquidity in people's hands. As a result, in this example, consumption and investment expenditures grow, as does aggregate demand (AD).
25. Draw a hypothetical propensity to consume curve and from it draw a propensity to save curve.
Ans: The sum of consumption and saving is always equal to income because income is either consumed or saved. It implies that consumption and saving curves, which represent consumption and saving functions, are mutually exclusive. Thus, given the income, we can directly derive the saving function from the consumption function, as shown in Fig, which consists of Part A displaying the consumption function and Part B displaying the saving function.
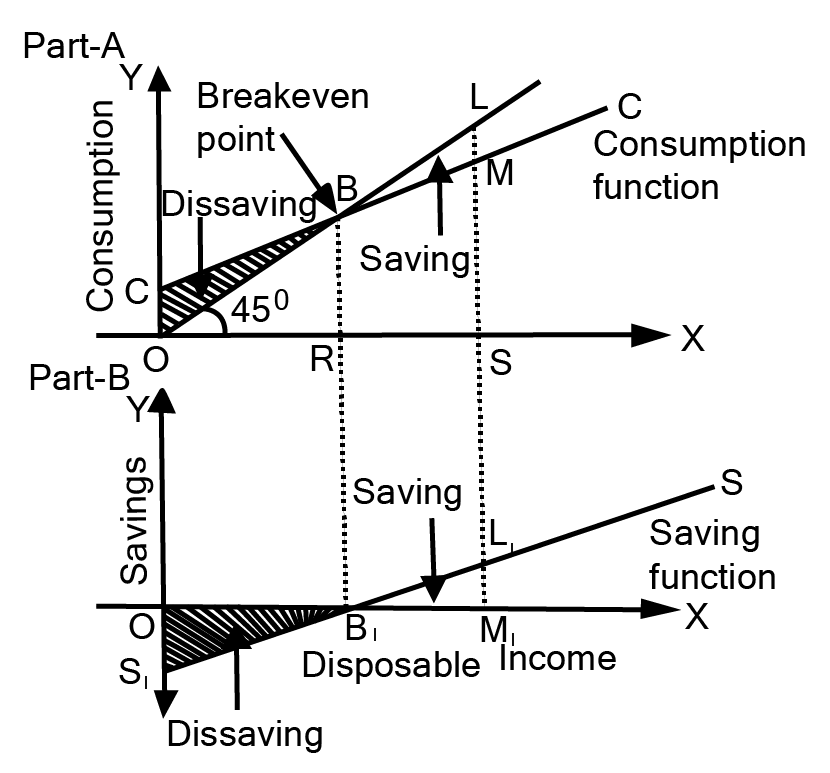
In Part A of the accompanying Figure, the CC curve represents the consumption function for each level of income, whereas the 45° line OL represents income.
Because the 45° line divides the graph into two equal parts, each point on this line is equidistant from the X and Y axes.
The CC curve intersects the 45° line OL at point B, where BR is equal to OR, i.e., consumption equals income.
As a result, point B is known as the breakeven point. There is no saving at point B, but to its left, the consumption function is above the 45° line, indicating negative saving (dissaving), and to its right, the consumption function is above the 45° line, indicating positive saving.
Part B now deduces the saving function in the form of a saving curve. Remember that the amount of saving (or dissaving) in Part A is the vertical distance between the CC curve and the 45° line.
We can derive a saving curve by plotting vertical distances from Part A in Part B of the Figure and connecting them.
For example,
In Part A, at 0 (zero) level of income, vertical distance OC (representing dissaving) is plotted as OS1 in Part B.
Similarly, at the OR level of income in Part A, the vertical distance between the CC curve and the 45° line at point B is nil (indicating zero saving) and is depicted as point Bj at the same level of income in Part B.
LM vertical distance of part A is shown as L1M1 in Part B at the OS level of income. We get the saving curve by connecting the points St, Bt, and Lv. Thus, in the form of a saving curve, the saving function is diagrammatically derived from the consumption function. (Similarly, the consumption curve can be derived from the saving curve.)
Important Topics in Class 12 Chapter 4 Economics
Students will learn about the below-listed major topics in this chapter of Class 12 Macro Economics.
Aggregate Demand and its Component
Aggregate Supply
Consumption Function
Induced Consumption
Types of Consumption Function
Average Propensity to Consume
Marginal Propensity to Consume
Saving Function
Average Propensity to Save
Marginal Propensity to Save
Relationship between APC and APS
Relationship between MPC and MPS
Investment
Types of Investment
Equilibrium Level of Income
Full Employment
Voluntary and Involuntary Unemployment
Under Employment
Investment Multiplier
Excess Demand
Inflationary Gap
Deficient Demand
Deflationary Gap
Methods to Control Excess Demand and Deficient Demand
Conclusion
As you may have guessed, this chapter on Determination of Income and Employment covers a wide range of topics, including demand, supply, investment, the consumption function, different types of investments, employment, different types of unemployment, the inflationary and deflationary gap, and so on.
Solve the previous year's Class 12 Economics question papers accessible on our website and mobile app to check your comprehension of this chapter. You can also join up for our one-on-one LIVE lessons and access the study tools for all other courses for free if you need more help with your 12th Board test preparation.
Important Study Material Links for Class 12 Macroeconomics Chapter 4
CBSE Class 12 Economics Important Questions Textbooks
Chapter-wise Links for Macroeconomics Class 12 Questions
Related Study Materials Links for Class 12 Macroeconomics
Along with this, students can also download additional study materials provided by Vedantu for Macroeconomics Class 12–

FAQs on Important Questions For Class 12 Macro Economics Chapter 4 Determination of Income and Employment - 2026-27
1. What are the most important areas to focus on when preparing for board mark questions in CBSE Class 12 Macro Economics Chapter 4: Determination of Income and Employment?
The most important areas include Aggregate Demand and its components, Consumption and Saving Functions, Equilibrium Income determination, Multiplier effect, Inflationary and Deflationary Gaps, and measures to correct excess or deficient demand. These topics consistently feature in board exams, often in 3- and 6-mark questions as per CBSE trends.
2. How does CBSE structure HOTS (Higher Order Thinking Skills) questions for Chapter 4, and how should students approach them?
HOTS questions typically require application of concepts beyond definitions. For example, you may need to interpret an economic scenario, calculate using formulas (like the multiplier), or evaluate the effectiveness of monetary tools. To score well, break the question into steps:
- Identify what the question is testing (concept or calculation).
- Write all relevant formulas (e.g., multiplier K = 1/(1-MPC)).
- Justify each step in your reasoning.
3. Which question types from Chapter 4 are most frequently asked for 3-mark and 4-mark sections in board exams?
Commonly repeated types include:
- Explaining differences (e.g., ex-ante vs ex-post investment; voluntary vs involuntary unemployment).
- Interpreting formulae (e.g., write and explain S = –a + (1–b)Y).
- Simple numericals on equilibrium income and multiplier.
- Steps for correcting demand gaps using policy tools.
4. Why is understanding the relationship between APC and APS critical for scoring in board exams?
Average Propensity to Consume (APC) and Average Propensity to Save (APS) are vital because their relationship shows how national income is distributed between consumption and saving. Board questions often ask direct relations (APC + APS = 1) or apply these to scenarios. Mastering the formula and its economic reasoning ensures full marks in related exam questions.
5. How can students avoid common calculation mistakes in investment multiplier numericals during board exams?
To avoid losing marks:
- Always use MPC (not MPS) in the formula K = 1/(1–MPC).
- Plug in the correct values with units (e.g., Rs. or lakhs).
- Apply each step sequentially and check your multiplication/division.
- For multi-step questions, clearly state intermediate results.
6. What key concepts should be included when answering a 6-mark question on the inflationary or deflationary gap for CBSE exams?
Your answer should cover:
- Definition of the gap (inflationary: excess demand; deflationary: deficient demand).
- Relevant formula or diagram (aggregate demand and supply intersection).
- Causes and economic impact.
- Monetary and fiscal policy tools to correct the gap, explaining each (e.g., changes in CRR/SLR, open market operations, government spending).
7. In exam scenarios, how should students distinguish between voluntary and involuntary unemployment as required by CBSE?
Voluntary unemployment occurs when people choose not to work at the current wage. Involuntary unemployment means individuals are willing to work at the prevailing wage but cannot find jobs. Exam answers should define both, give clear examples, and possibly relate to their role in full employment equilibrium—as often required by CBSE’s 3-mark and 4-mark questions.
8. What strategies should be followed to efficiently tackle long-answer (6-mark) board questions from this chapter?
For long answers:
- Structure your response with headings or numberings (definition, explanation, diagram where required, real-world example, and conclusion).
- Highlight key concepts in bold or underline during revision.
- Connect each point to the question’s requirement using CBSE’s marking scheme (like distinguishing between causes, effects, and remedies).
9. How can misconceptions about the working of the multiplier lead to loss of marks, and how can they be avoided in exam answers?
Frequent misconceptions include believing the multiplier effect is instant or ignoring leakages (taxes, savings, imports). To avoid losing marks:
- Explain that the multiplier operates in successive rounds of spending until equilibrium is reached.
- State that any leakages reduce the final impact.
- Always use MPC accurately in the calculation.
10. What is the significance of the break-even point on the consumption function curve in the context of board marking?
The break-even point is where income equals consumption (Y = C), meaning saving is zero. This is a crucial marking point in diagram and explanation questions, especially when identifying or deriving the saving function from the consumption curve, as per CBSE requirements.
11. How can students interpret and solve numerical problems involving equilibrium income for maximum board marks?
Follow a systematic process:
- Write the key formula (Y = C + I, or extended for additional components).
- Substitute the given values carefully, maintaining stepwise clarity.
- Show calculation for income as well as, if asked, related values like consumption or saving.
12. Why are questions related to correcting excess and deficient demand so important for board exams?
These questions test both theoretical understanding and practical application of macroeconomic policy. Students must know the various tools (like CRR, SLR, open market operations, government expenditure) and explain how each tool works to restore equilibrium. Their frequent appearance and alignment with current economic issues make them essential for revision and scoring high in board assessments.
13. How should diagrams for savings and consumption functions be labeled and explained in long-answer questions?
Diagrams must include:
- X and Y axes clearly labeled (Income, Consumption/Saving).
- 45° line (where income equals consumption).
- Curves for both consumption and saving functions.
- Breakeven point and intercepts explained in text.
14. What type of analytical reasoning might the CBSE expect in 4-mark HOTS questions related to Chapter 4?
CBSE often expects:
- Interpreting the effects of changes in macro variables (like investment, interest rate, or government policy) on national income and employment.
- Applying formulas in new or unfamiliar scenarios.
- Comparing theoretical models to real-world examples or recent economic situations.
15. What are the current exam trends for selection and distribution of important questions from Chapter 4, according to the CBSE 2025–26 syllabus?
Recent papers tend to balance between short answer conceptual queries (1–2 marks), application-based calculation questions (3–4 marks), and detailed analytical or policy-focused questions (6 marks). Key areas include multiplier, demand and supply equilibrium, gaps (inflationary/deflationary), and policy correction tools. Preparing sample answers for each type improves overall scoring potential in the board exam context.