


Maths Notes for Chapter 12 Smart Charts Class 5 - FREE PDF Download
Summary of “Smart Charts”
This chapter aims to make us understand the importance of tables and charts.
There are mainly five different types of smart charts:
Tally Marks
Tabular Forms
Pie Charts
Bar Graphs
Family Tree
Tally Marks
Tally Marks are used to keep track of numbers as quickly as possible.
Tally marks are used for counting and are shown as a set of five lines, four vertical lines (one vertical line for each of the first four numbers), and a diagonal line across the preceding four numbers.
Let’s See Tally Marks To Understand It More Clearly:
For each of the four counts, we added a vertical line (|).
For the fifth count, a diagonal line (/) is added. Tally markings can be seen here.

Tally Marks for the Number of Animals
Tables
A presentation of information or data called a table is usually made up of rows and columns. However, it may sometimes have a more sophisticated structure.
Tables consist of two major parts, i.e. Rows and Columns.
A column is vertical in alignment, whereas a row is horizontal.
Tables are frequently used in data analysis, research, and communication.
Below table has 5 columns and 4 rows. Using this table, we can easily understand the number of males and females in each game.
Pie Charts
A pie chart is a sort of chart that shows data in a circular graph.
It is one of the most often used graphs for representing data by combining the qualities of circles to reflect real-world information.
A pie chart is circular, with the pie representing the entire data and the slice out of the pie representing the parts of the data and recording it individually.
Let us look at the following example of the following pie chart that represents the different percentages for each slice.
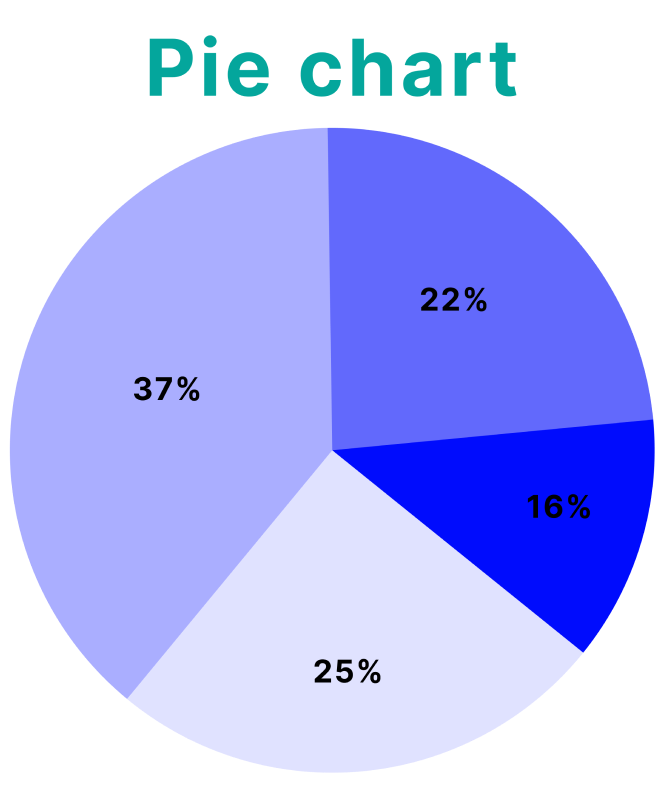
Example: The following pie chart represents the number of students in class with their favorite sports:
Cricket: 37%
Football: 25%
BasketBall: 22%
Volleyball: 16%
Pie Chart
Bar Charts
A visual way to compare quantitative data using rectangles whose lengths are proportionate to the quantity of the data or items being compared; also known as a bar chart.
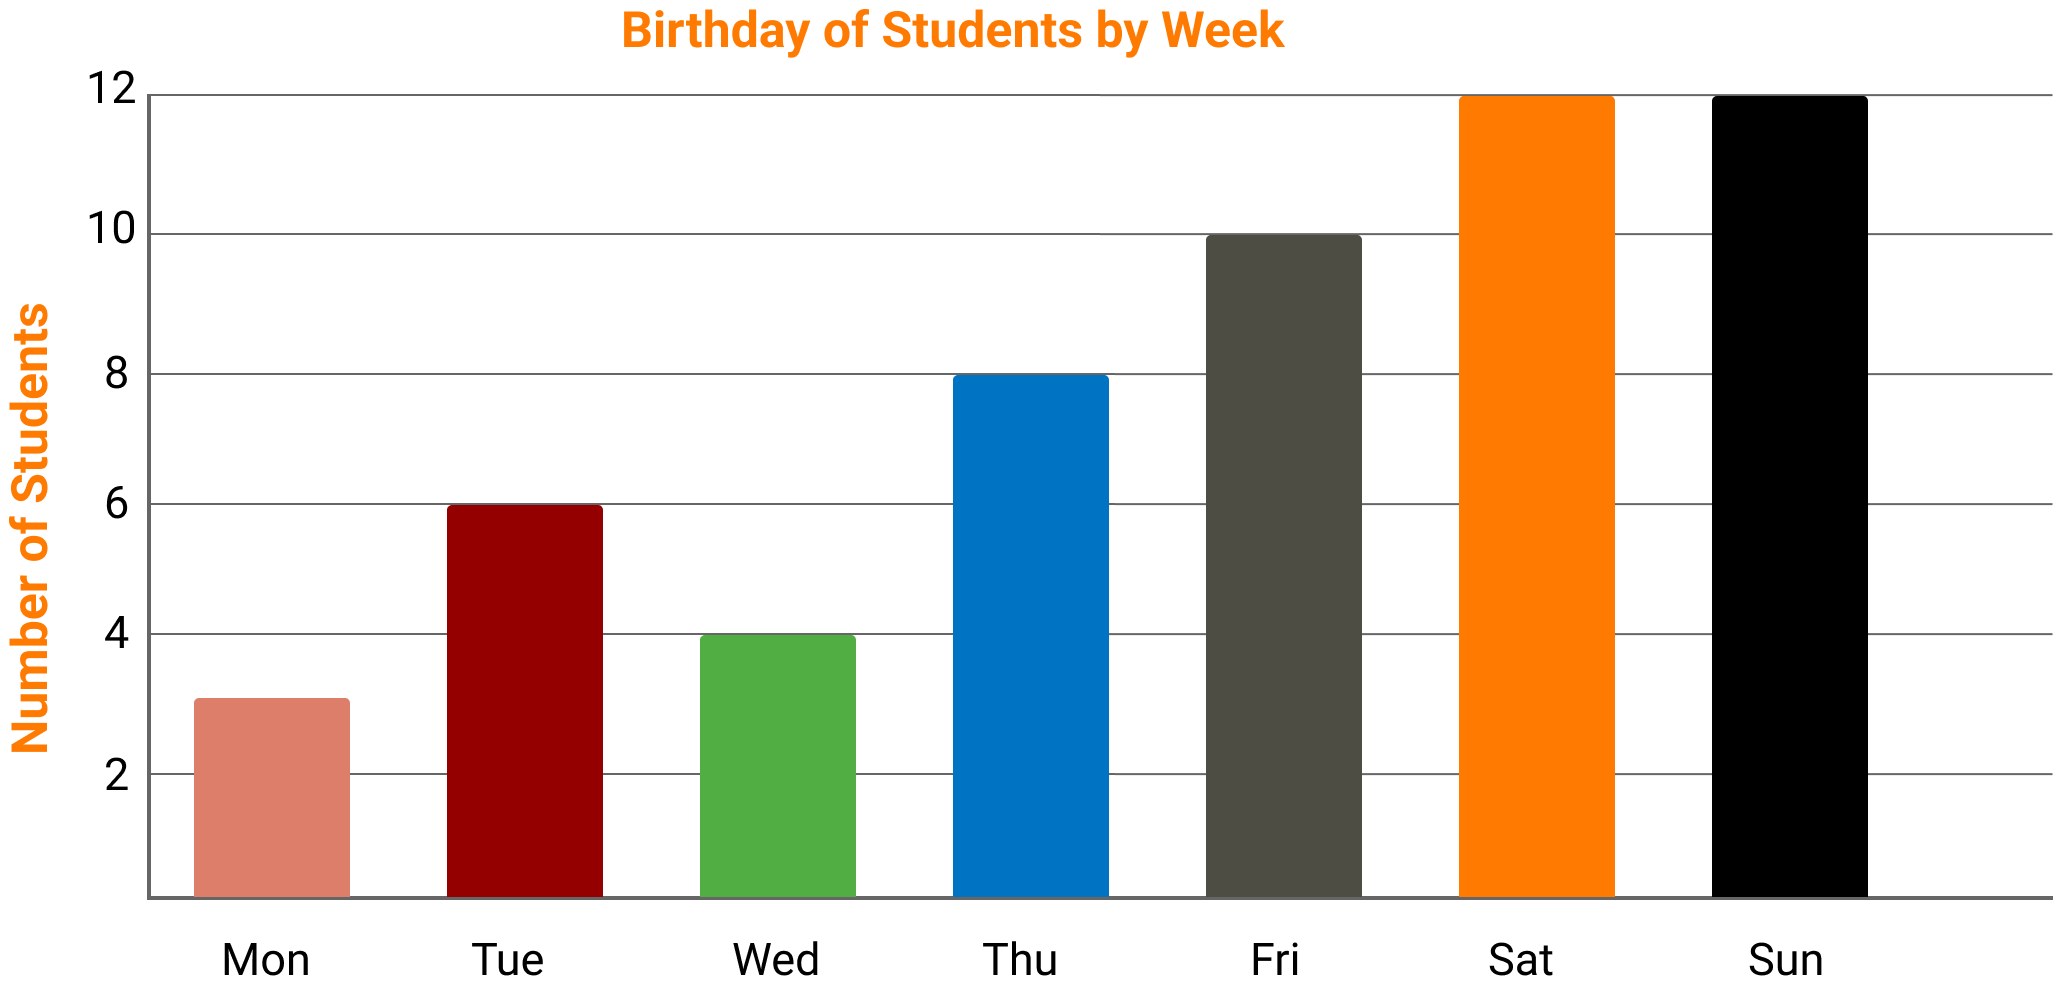
Bar Graph
Family Tree
A family tree is a graphical or visual representation of our ancestors.
A family tree not only helps us understand our history, but it also helps us comprehend our relationships with other people who share shared ancestors.
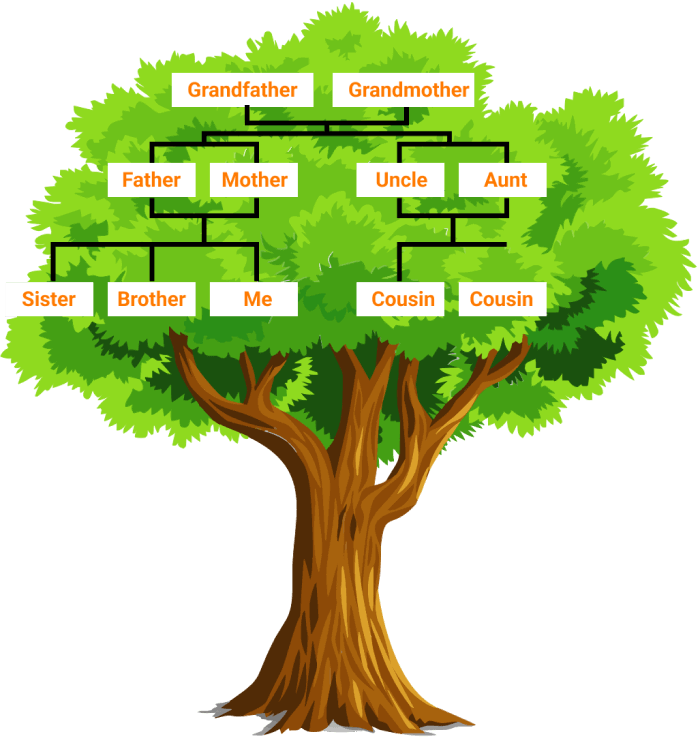
A Family Tree
Solved Examples
Q1.
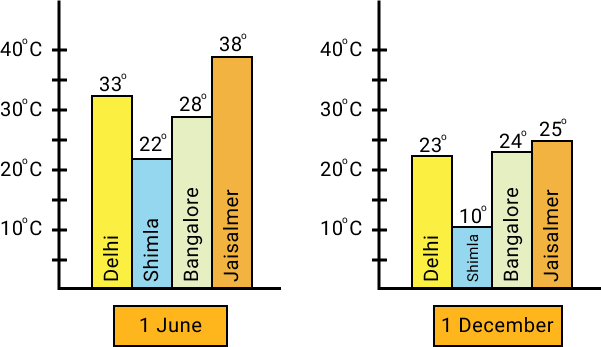
Temperature Graph
Find Out From the Bar Chart:
1. Which city is hottest on 1 June?
Ans: Jaisalmer is hottest on 1 June
2. Which city is coldest on 1 December?
Ans: Shimla is coldest on 1 December
3. Which city shows little change in temperature on the two days ----1 June and 1 December?
Ans: Bangalore shows little change in temperature on the two days. Lowest change = 28 – 24 = 4 degree Celcius.
Exercise
Q1. Ajay made a record of his favourite animals he saw in the zoo. Make a tally chart and answer the following questions.

Tally Chart
Q 1. How many Tigers are there?
Q 2. What is the difference between the number of tigers and elephants?
Q 3. Which is more Giraffe or Lion?
Q 4. How many animals in total did Ajay see?
Ans:
14
6
Lion
52
Q 2. Given below is the representation of different vehicles in a town. Study and answer the questions. (1 ☆ = 10 vehicles)

Number of Vehicles in a Town
(a) Which vehicle is the maximum in town?
(b) Which vehicle is 50 in number?
(c) What is the total number of vehicles in the town?
Ans: a) Motobike
b) Car
c) 360
Tricks for Student:
Check your work at the end, as most of the questions are based on counting any representation and calculating it. So after doing the calculation, check it again.
While drawing a graph, always take care of the scale and ratio of the graph.
Always keep in mind the hierarchy while making the family tree.
Importance of CBSE Class 5 Chapter 12 Smart Charts
The syllabus of Class 5 Maths is unique in terms of creating a conceptual foundation of various mathematical concepts. The importance of Chapter 12 can be understood from the following points.
Understanding the difference between rows and columns
Creating a conceptual foundation for making tables by including rows and columns
Learning how to figure out information from a given table and answering questions
Perfect way of delivering knowledge with pictures
Reading information from words and pictures simultaneously and answering questions
Understanding the type, similarity, dissimilarity, and eligibility of data in simpler versions to introduce in a particular table
Studying Smart Charts Class 5 will help make students better in thinking logically and solving problems accordingly. It is formulated to create a strong foundation for formulating tables, using data, and extracting information. Hence, the students will be introduced to the basic level of statistics at a young age.
Benefits of Vedantu’s Maths Chart for Class 5 Revision Notes
Now that you have understood the importance of this chapter, here is how Vedantu can deliver the best results with its revision notes and worksheets.
Learning What is Smart Chart
As mentioned earlier, you will learn the definition and use of smart charts for the first time in Class 5. The revision notes for this chapter will be the ideal study material to refer to grab hold of the concept.
Quick Resolution of Doubts
All the doubts rising in your mind can be resolved by using the simpler explanation of concepts in these revision notes.
A Basic Introduction to Statistics
Children will also get excellent support in studying these basic concepts related to statistics and other advanced mathematical operations. They will learn how to input data in charts for objects, things, activities such as dice throwing, etc.
Learning to Identify and Differentiate Objects
The revision notes will also help you by getting smart with charts. Learn how to differentiate between various objects and their eligibility.
Getting Smart with Charts Has Become Easier
NCERT Solutions plays a crucial role in Class 6 exam prep. Start by thoroughly reading the textbook chapter. After that, solve the NCERT questions for Class 5 Chapter 12 - Smart Charts. You can find detailed solutions on Vedantu, aligning with CBSE guidelines. Download the free NCERT Solutions for Class 5 Chapter 12 - Smart Charts to guide your exam preparation with expert-reviewed answers. Download the revision notes today for free and check what we see on the road. Prepare the answers in the best way possible to save time and score better in the exams. Visit our website to download the PDFs for free and find other related study materials.
Related Study Materials for Class 5 Maths Chapter 12
Chapter-wise Revision Notes Links for Class 5 Maths
Important Study Materials for Class 5 Maths
FAQs on CBSE Notes Class 5 Maths Chapter 12 - Smart Charts - 2026-27
1. Why is getting Smart with Charts easier with Vedantu?
The experts compile answers and explain concepts of Maths chapters using a simpler language. They also follow the CBSE guidelines to ensure the explanation matches the standard of the Class 5 students.
2. How can you use revision notes to make smart charts?
Experts will explain how to make tables using the information embedded in the pictures. Focus on making tables. You will also learn how to answer questions based on the Smart Charts summary.
3. How can I prepare Chapter 12 smart charts before an exam?
The preparation of Chapter 12 Smart Charts becomes easier with Vedantu’s revision notes and worksheets. Practice worksheets and take a glance at the concepts in the notes before an exam.