


In 1610, Galileo used his telescope to discover four moons around Jupiter, with mean the mean orbital radii $a$ and periods $T$:
Plot $\log a$($y$ axis) against $\log T$($x$ axis) and show that you get a straight line.
Name $a({10^8}m)$ $T$ (days) ${I_O}$ $4.22$ $1.77$ Europa $6.71$ $3.55$ Ganymede $10.7$ $7.16$ Calisto $18.8$ $16.7$
| Name | $a({10^8}m)$ | $T$ (days) |
| ${I_O}$ | $4.22$ | $1.77$ |
| Europa | $6.71$ | $3.55$ |
| Ganymede | $10.7$ | $7.16$ |
| Calisto | $18.8$ | $16.7$ |
Answer
233.1k+ views
Hint: Take the logarithmic value of the radii and the time periods. Make a table and then plot the graph.
Complete step by step solution:
Firstly, taking the logarithmic value of radii and time periods,
In the above given chart, we can see that the graph is a straight line.
Note: JUPITHER, IO, Europe, Ganymede and Calisto are four of Galileo's biggest stars. In December1609 or January1610, Galileo Galilei first saw them and in March1620 he was recognised as a Jupiter satellite. They became the first objects to orbit another planet than the Earth. With the exception of the Sun and the eight planets, they are one of the biggest objects in the Solar System, with radii greater than any dwarf planet. It is much larger than the planet Mercury, though just about half as large, and it's the greatest moon in the Solar system. In 4:2:1 orbital resonance, the three inner Luna’s — Io, Europa and Ganymede. While the Galilean moons are spherical, all the other moons of Jupiter are of irregular shapes owing to their poorer self-gravity.
Complete step by step solution:
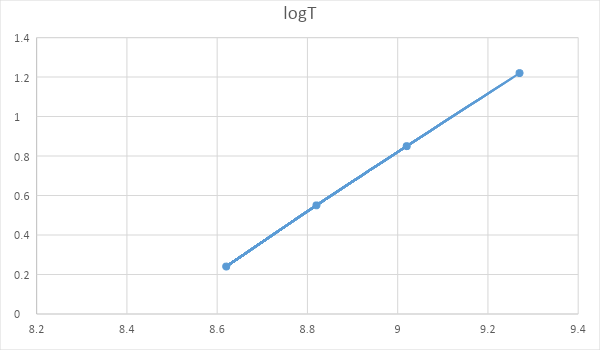
Firstly, taking the logarithmic value of radii and time periods,
| Name | $\log a$ | $\log T$ |
| ${I_O}$ | $8.62$ | $0.24$ |
| Europa | $8.82$ | $0.55$ |
| Ganymede | $9.02$ | $0.85$ |
| Calisto | $9.27$ | $1.22$ |
In the above given chart, we can see that the graph is a straight line.
Note: JUPITHER, IO, Europe, Ganymede and Calisto are four of Galileo's biggest stars. In December1609 or January1610, Galileo Galilei first saw them and in March1620 he was recognised as a Jupiter satellite. They became the first objects to orbit another planet than the Earth. With the exception of the Sun and the eight planets, they are one of the biggest objects in the Solar System, with radii greater than any dwarf planet. It is much larger than the planet Mercury, though just about half as large, and it's the greatest moon in the Solar system. In 4:2:1 orbital resonance, the three inner Luna’s — Io, Europa and Ganymede. While the Galilean moons are spherical, all the other moons of Jupiter are of irregular shapes owing to their poorer self-gravity.
Recently Updated Pages
JEE Main 2023 April 6 Shift 1 Question Paper with Answer Key
JEE Main 2023 April 6 Shift 2 Question Paper with Answer Key
JEE Main 2023 (January 31 Evening Shift) Question Paper with Solutions [PDF]
JEE Main 2023 January 30 Shift 2 Question Paper with Answer Key
JEE Main 2023 January 25 Shift 1 Question Paper with Answer Key
JEE Main 2023 January 24 Shift 2 Question Paper with Answer Key
Trending doubts
JEE Main 2026: Session 2 Registration Open, City Intimation Slip, Exam Dates, Syllabus & Eligibility
JEE Main 2026 Application Login: Direct Link, Registration, Form Fill, and Steps
JEE Main Marking Scheme 2026- Paper-Wise Marks Distribution and Negative Marking Details
Understanding the Angle of Deviation in a Prism
Hybridisation in Chemistry – Concept, Types & Applications
How to Convert a Galvanometer into an Ammeter or Voltmeter
Other Pages
JEE Advanced Marks vs Ranks 2025: Understanding Category-wise Qualifying Marks and Previous Year Cut-offs
Laws of Motion Class 11 Physics Chapter 4 CBSE Notes - 2025-26
Waves Class 11 Physics Chapter 14 CBSE Notes - 2025-26
Mechanical Properties of Fluids Class 11 Physics Chapter 9 CBSE Notes - 2025-26
Thermodynamics Class 11 Physics Chapter 11 CBSE Notes - 2025-26
Units And Measurements Class 11 Physics Chapter 1 CBSE Notes - 2025-26