


Draw the graphs showing variation of the photoelectric current with applied voltage for two incident radiations equal frequency and different intensities. Mark the graph for radiation of higher intensity.
Answer
233.1k+ views
Hint: In the process of photoelectric effect, the electrons from the metal surface are made to emit with the use of the light radiations which incident on it. These electrons are used as the current and it is known as photo electric current.
Complete step by step solution:
The radiation incident on the metal surface influences the output photo current of the metal. The suitable radiation produces the photo current which is directly proportional to the intensity of the radiation that incident on the surface of the metal. Intensity is defined as the power of the incident light that falls on the metal surface. The frequency is the number of times the repeated event occurs over a given time. The below graph represents the variation of the photocurrent of the two equal voltages with the same frequency but the different intensities.
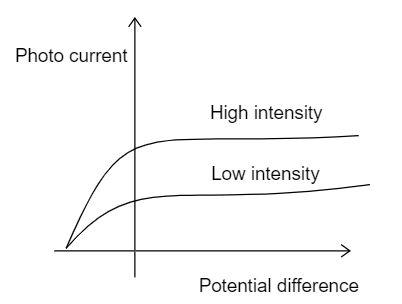
Hence the graph shows that the radiations of the same frequency but the different intensity may produce the different photocurrent from the metal. Hence the intensity of the radiation has the most influence in the production of the photocurrent.
Note: The point at which the photocurrent is maximum, it is called as the saturation current and point in which the photo current becomes zero, it is called as the cut- off voltage. The cut- off voltage is also called stopping potential.
Complete step by step solution:
The radiation incident on the metal surface influences the output photo current of the metal. The suitable radiation produces the photo current which is directly proportional to the intensity of the radiation that incident on the surface of the metal. Intensity is defined as the power of the incident light that falls on the metal surface. The frequency is the number of times the repeated event occurs over a given time. The below graph represents the variation of the photocurrent of the two equal voltages with the same frequency but the different intensities.
Hence the graph shows that the radiations of the same frequency but the different intensity may produce the different photocurrent from the metal. Hence the intensity of the radiation has the most influence in the production of the photocurrent.
Note: The point at which the photocurrent is maximum, it is called as the saturation current and point in which the photo current becomes zero, it is called as the cut- off voltage. The cut- off voltage is also called stopping potential.
Recently Updated Pages
JEE Main 2026 Session 2 Registration Open, Exam Dates, Syllabus & Eligibility
JEE Main 2023 April 6 Shift 1 Question Paper with Answer Key
JEE Main 2023 April 6 Shift 2 Question Paper with Answer Key
JEE Main 2023 (January 31 Evening Shift) Question Paper with Solutions [PDF]
JEE Main 2023 January 30 Shift 2 Question Paper with Answer Key
JEE Main 2023 January 25 Shift 1 Question Paper with Answer Key
Trending doubts
JEE Main Marking Scheme 2026- Paper-Wise Marks Distribution and Negative Marking Details
Why does capacitor block DC and allow AC class 12 physics JEE_Main
Understanding Average and RMS Value in Electrical Circuits
Understanding Collisions: Types and Examples for Students
Ideal and Non-Ideal Solutions Explained for Class 12 Chemistry
Understanding Atomic Structure for Beginners
Other Pages
JEE Advanced Weightage 2025 Chapter-Wise for Physics, Maths and Chemistry
CBSE Class 12 Physics Set 2 (55/2/2) 2025 Question Paper & Solutions
Inductive Effect and Its Role in Acidic Strength
Degree of Dissociation: Meaning, Formula, Calculation & Uses
Units and Measurements Mock Test for JEE Main 2025-26 Preparation
Chemistry Question Papers for JEE Main, NEET & Boards (PDFs)