


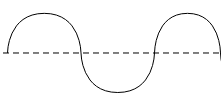
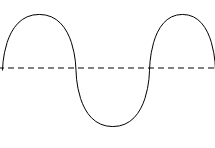
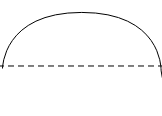
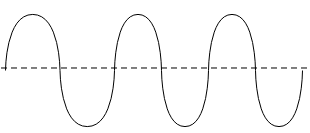
All the waves shown have the same speed in the same medium. Use a ruler (or eyeball if you can) and rank these waves from most to least for
(a). amplitude
(b). wavelength
(c). frequency
(d). period


Answer
552.9k+ views
Hint: The wave is a disturbance in a medium which propagates through propagation of vibration. The properties of the wave are defined by the amplitude, wavelength, frequency etc. We know that the wavelength and frequency are inversely proportional to each other and the reciprocal of frequency is time period. Therefore, using these relations, the highest and lowest of the graphs can be determined without using a ruler.
Complete answer:
A wave is a disturbance which moves forward by propagation of the disturbance or vibrations between molecules. The waves are described using different parameters.
Amplitude is the maximum distance that a particle moves from its mean position. The length of crest or trough from the axis is known as amplitude.
Wavelength is the displacement covered by a point on the wave in unit time. Its SI unit is metres ($m$).
Frequency is the number of waves that pass through a point in unit time. It is the reciprocal of time period. Its SI unit hertz ($Hz$).
The time taken to complete one oscillation by a wave is known as time period. Its SI unit is second ($s$).
(a). From the given graphs, the graph with the highest amplitude is

As the height of the crest or trough from the axis is highest, the graph with the lowest amplitude is given below.

(b). The graph with the longest wavelength will be

As the most distance is covered in an oscillation by a particle on this wave while, the graph with the least wavelength is given below.

(c). we know that,
$\nu =\dfrac{c}{\lambda }$
Here, $\nu $ is the frequency
$c$ is the speed of light
$\lambda $ is the wavelength
From the above equation,
$\nu \propto \dfrac{1}{\lambda }$
Therefore, the graph with the highest wavelength will have the lowest frequency and vice versa. Thus, the graph with highest frequency is

While, the graph with lowest frequency is given below
(d). The frequency is the reciprocal of time period. Therefore,
$T=\dfrac{1}{\nu }$
Therefore, the graph with the highest frequency will have the lowest time period and vice versa. Thus, the graph with the highest time period is

And the graph with the lowest time period is given below
Therefore, the graphs with the highest and lowest of the following properties can be determined without using a ruler but just studying the definitions of properties and observing the graphs accordingly.
Note:
The wave is usually a trigonometric function and its highest magnitude is its amplitude. The wave represents the oscillation of a body between mean and extreme positions. The crests and troughs are the extreme positions while the point where the wave intersects the axis is the mean position.
Complete answer:
A wave is a disturbance which moves forward by propagation of the disturbance or vibrations between molecules. The waves are described using different parameters.
Amplitude is the maximum distance that a particle moves from its mean position. The length of crest or trough from the axis is known as amplitude.
Wavelength is the displacement covered by a point on the wave in unit time. Its SI unit is metres ($m$).
Frequency is the number of waves that pass through a point in unit time. It is the reciprocal of time period. Its SI unit hertz ($Hz$).
The time taken to complete one oscillation by a wave is known as time period. Its SI unit is second ($s$).
(a). From the given graphs, the graph with the highest amplitude is
As the height of the crest or trough from the axis is highest, the graph with the lowest amplitude is given below.
(b). The graph with the longest wavelength will be
As the most distance is covered in an oscillation by a particle on this wave while, the graph with the least wavelength is given below.
(c). we know that,
$\nu =\dfrac{c}{\lambda }$
Here, $\nu $ is the frequency
$c$ is the speed of light
$\lambda $ is the wavelength
From the above equation,
$\nu \propto \dfrac{1}{\lambda }$
Therefore, the graph with the highest wavelength will have the lowest frequency and vice versa. Thus, the graph with highest frequency is
While, the graph with lowest frequency is given below
(d). The frequency is the reciprocal of time period. Therefore,
$T=\dfrac{1}{\nu }$
Therefore, the graph with the highest frequency will have the lowest time period and vice versa. Thus, the graph with the highest time period is
And the graph with the lowest time period is given below
Therefore, the graphs with the highest and lowest of the following properties can be determined without using a ruler but just studying the definitions of properties and observing the graphs accordingly.
Note:
The wave is usually a trigonometric function and its highest magnitude is its amplitude. The wave represents the oscillation of a body between mean and extreme positions. The crests and troughs are the extreme positions while the point where the wave intersects the axis is the mean position.
Recently Updated Pages
Master Class 12 Economics: Engaging Questions & Answers for Success
Master Class 12 Physics: Engaging Questions & Answers for Success
Master Class 12 English: Engaging Questions & Answers for Success
Master Class 12 Social Science: Engaging Questions & Answers for Success
Master Class 12 Maths: Engaging Questions & Answers for Success
Master Class 12 Business Studies: Engaging Questions & Answers for Success
Trending doubts
Which are the Top 10 Largest Countries of the World?
What are the major means of transport Explain each class 12 social science CBSE
Draw a labelled sketch of the human eye class 12 physics CBSE
Why cannot DNA pass through cell membranes class 12 biology CBSE
Differentiate between insitu conservation and exsitu class 12 biology CBSE
Draw a neat and well labeled diagram of TS of ovary class 12 biology CBSE