


Steps to Draw a Graph with Table and Solved Examples
A graph is a diagram that shows the relationship between two different quantities. Varying quantities are the quantities that change with respect to other conditions. In a graph, these varying quantities are represented on two lines called axes. The two axes form a right angle with each other. The two axes are called the X-axis and the Y-axis. Another name for the X-axis is abscissa, and the Y-axis is ordinate.
Now that you have understood the graph and the axes let us move forward to drawing a graph.
A Graph and Its Functions
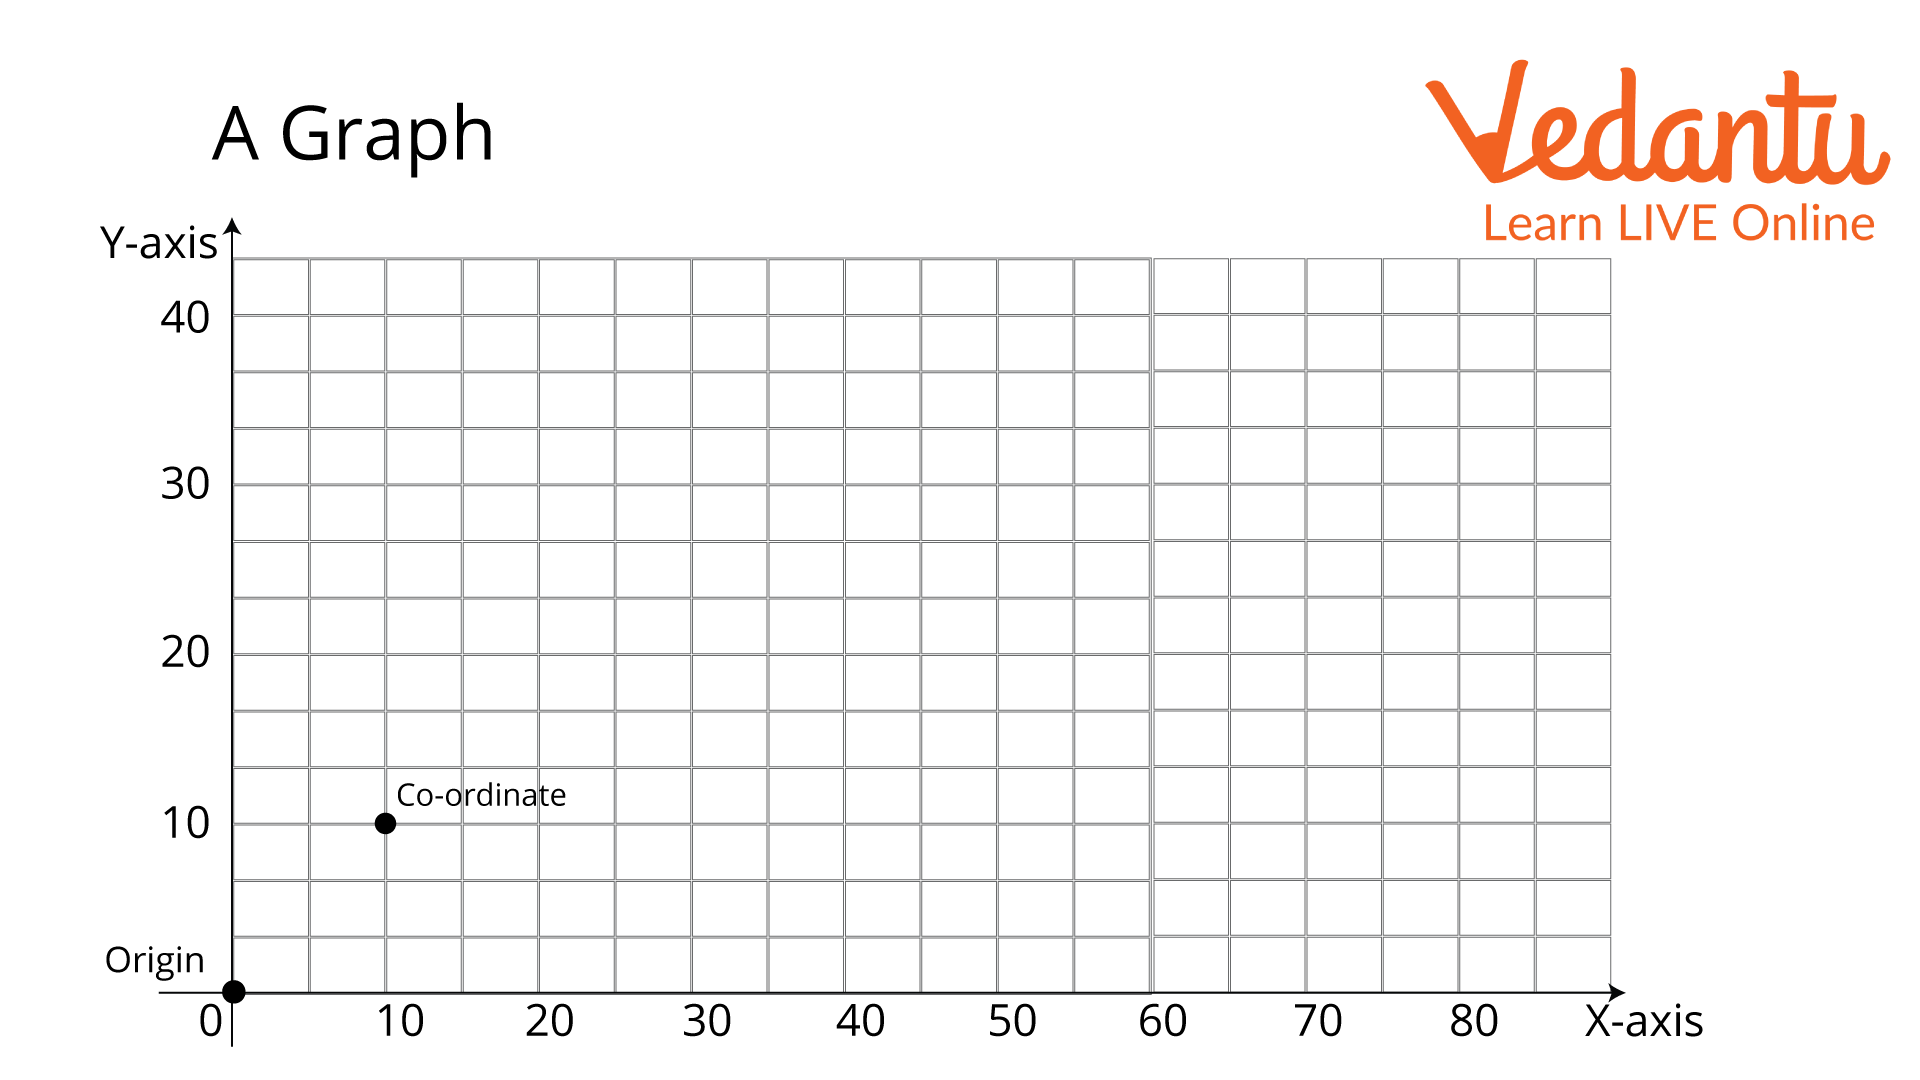
A Graph
You can observe from the above figure that the horizontal line is labelled as the X-axis or the abscissa, and the vertical line has been labelled as the Y-axis or the ordinate. You can also observe that both are making a right angle with each other. The point where these axes intersect is known as the origin, marked at zero, as shown in the image above. A graph is formed when many coordinates are connected to each other.
Types of Graphs
There are many types of graphs, like bar graphs, column graphs, histograms, frequency polygons, and many more; however, you will need to learn four basic types, which are given below:
Line Graph
In this type of graph, only coordinates are plotted on the graph, and these coordinates are connected together to form a line that is sometimes straight or curved. We will learn to draw a line graph later in this article.
Bar Graph
A bar graph is a chart or the visual representation of any quantity with the help of bars or strips. These bars or strips look like columns.
As shown below, a histogram is a bar graph that depicts frequency distribution.
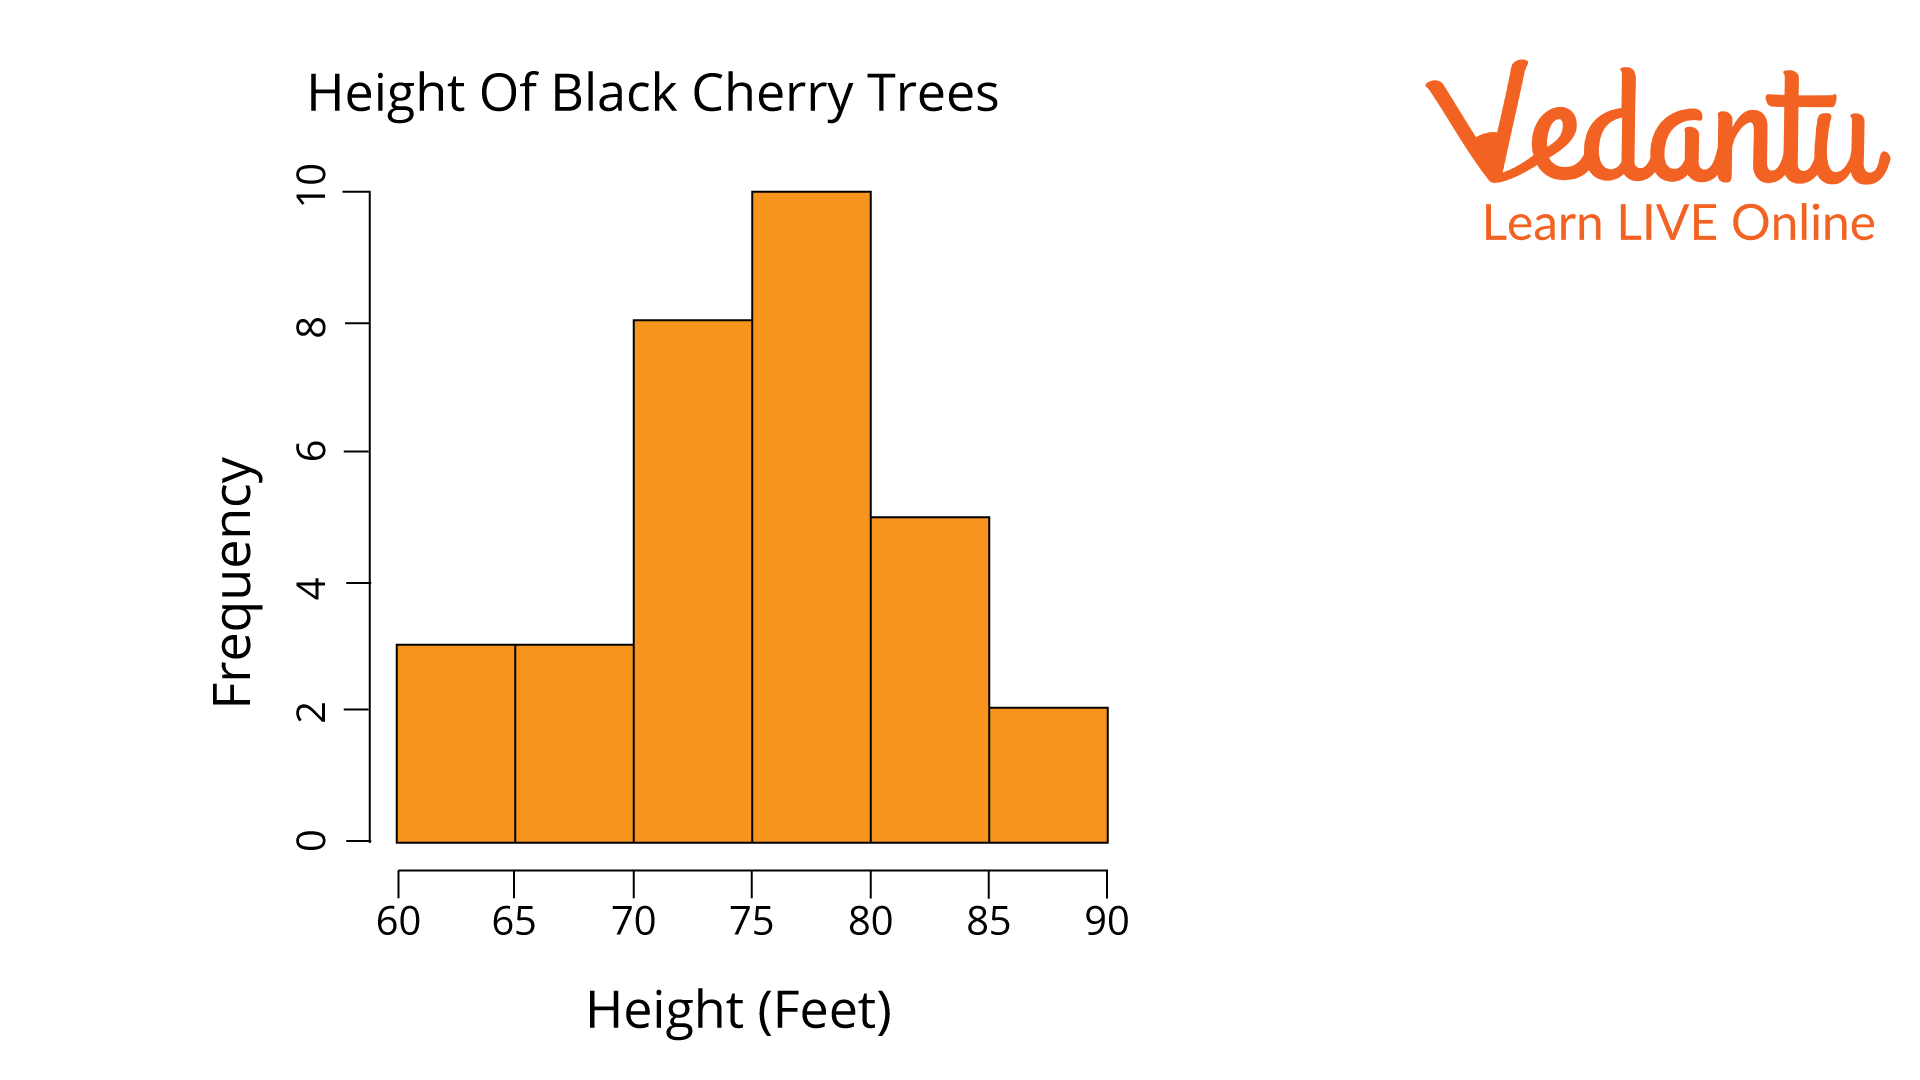
Histogram
Pie Chart
It is a circular figure that is divided into slices to show the proportion of the given quantities. Given below is a representation of a pie chart.
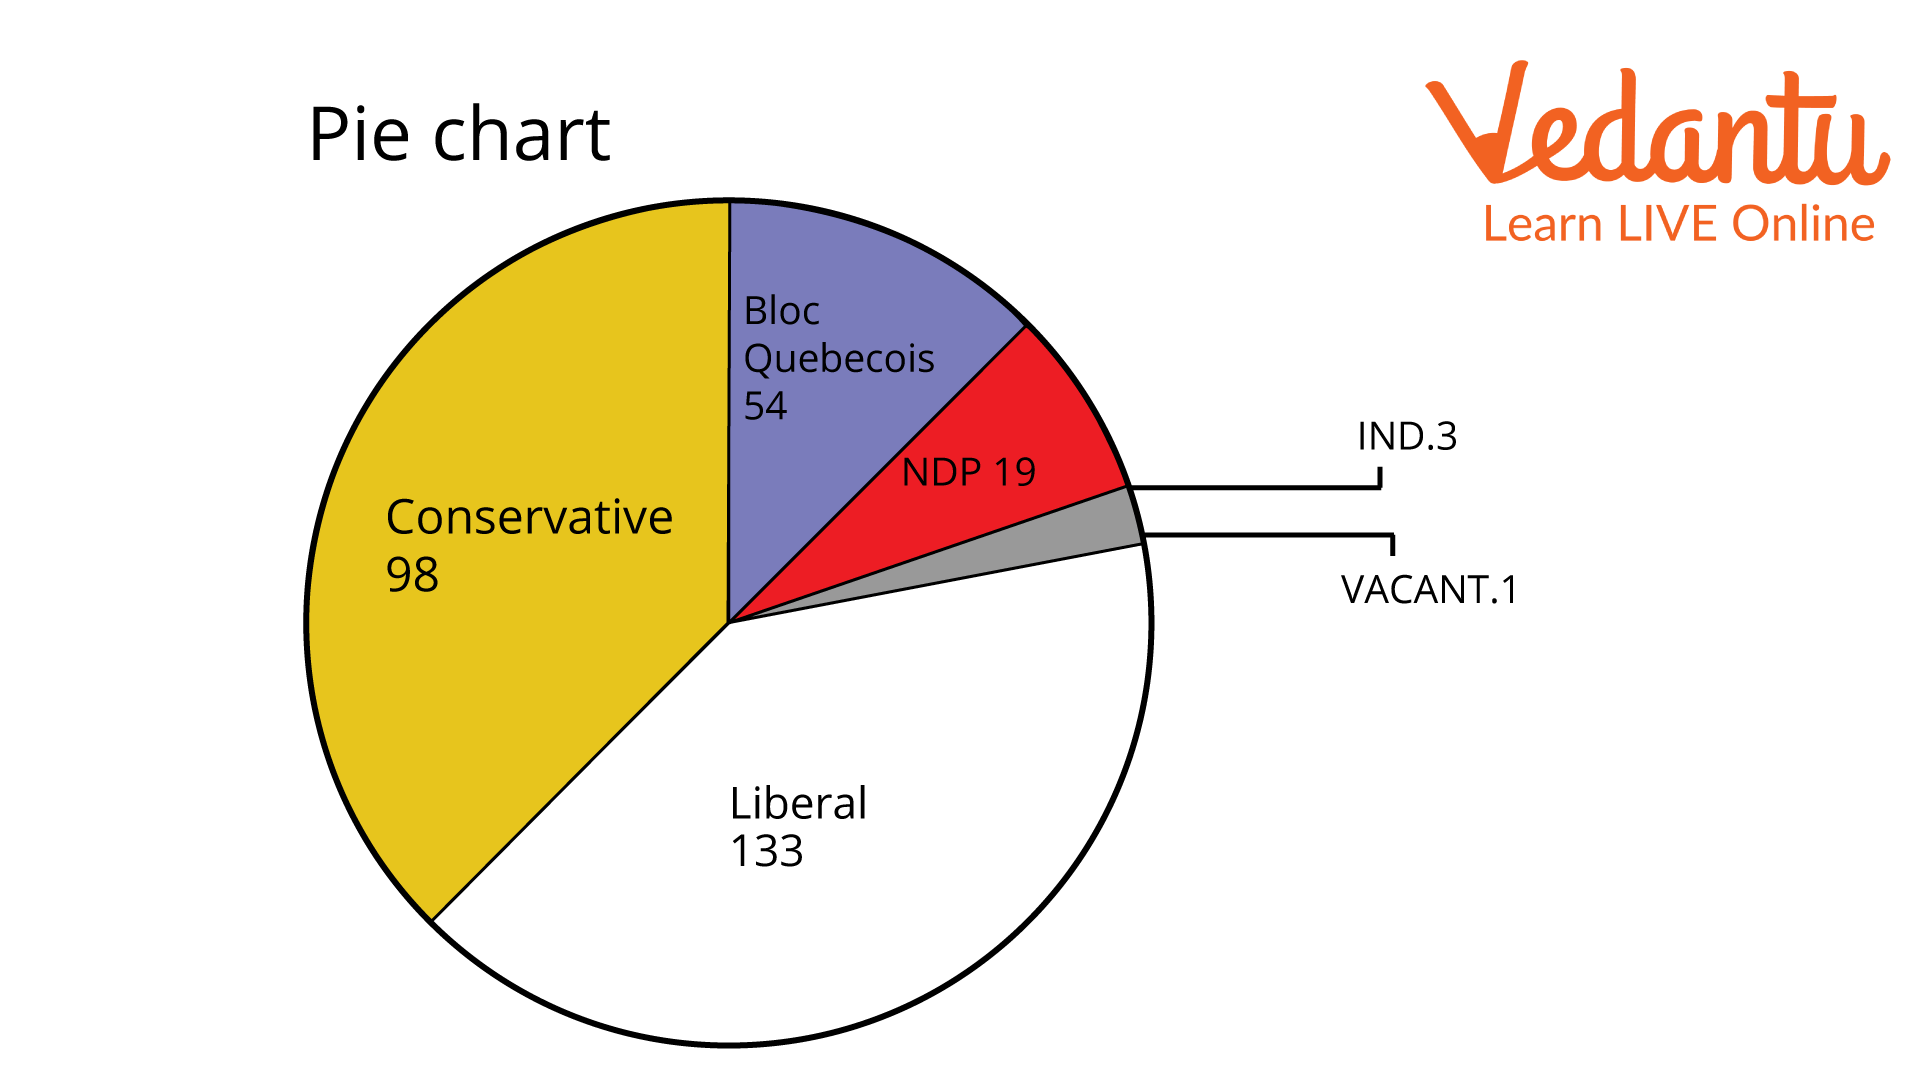
Pie chart
Steps to Draw a Graph
The line graph is the simplest form of a graph. Therefore, before proceeding to draw a graph of various types, you must learn to draw a line graph first. Therefore, let us first start by drawing a graph of x and y coordinates. Let us take an example so that you can understand the steps one by one. The question says, “Draw a graph with the variable y being dependent on the variable x by the relation y = 2x.” Here are the steps based on the example:
Determine the Given Variables
Since the instruction is to “Draw a graph with the variable y being dependent on the variable x by the relation y=2x.” This means that for any value of x, the value of y will be doubled.
Form a Table of X and Y Coordinates
Since you have determined the relationship between the variables, you can form a table of x and y coordinates as shown below.
Table of coordinates
Plot the Point
After you form a table and arrange the given data, plot the points on graph paper.
Take the scale of a graph as 1 unit = 10mm for x and 1 unit = 10mm for y. Start with the x coordinate and mark the point for the corresponding value given in the table.
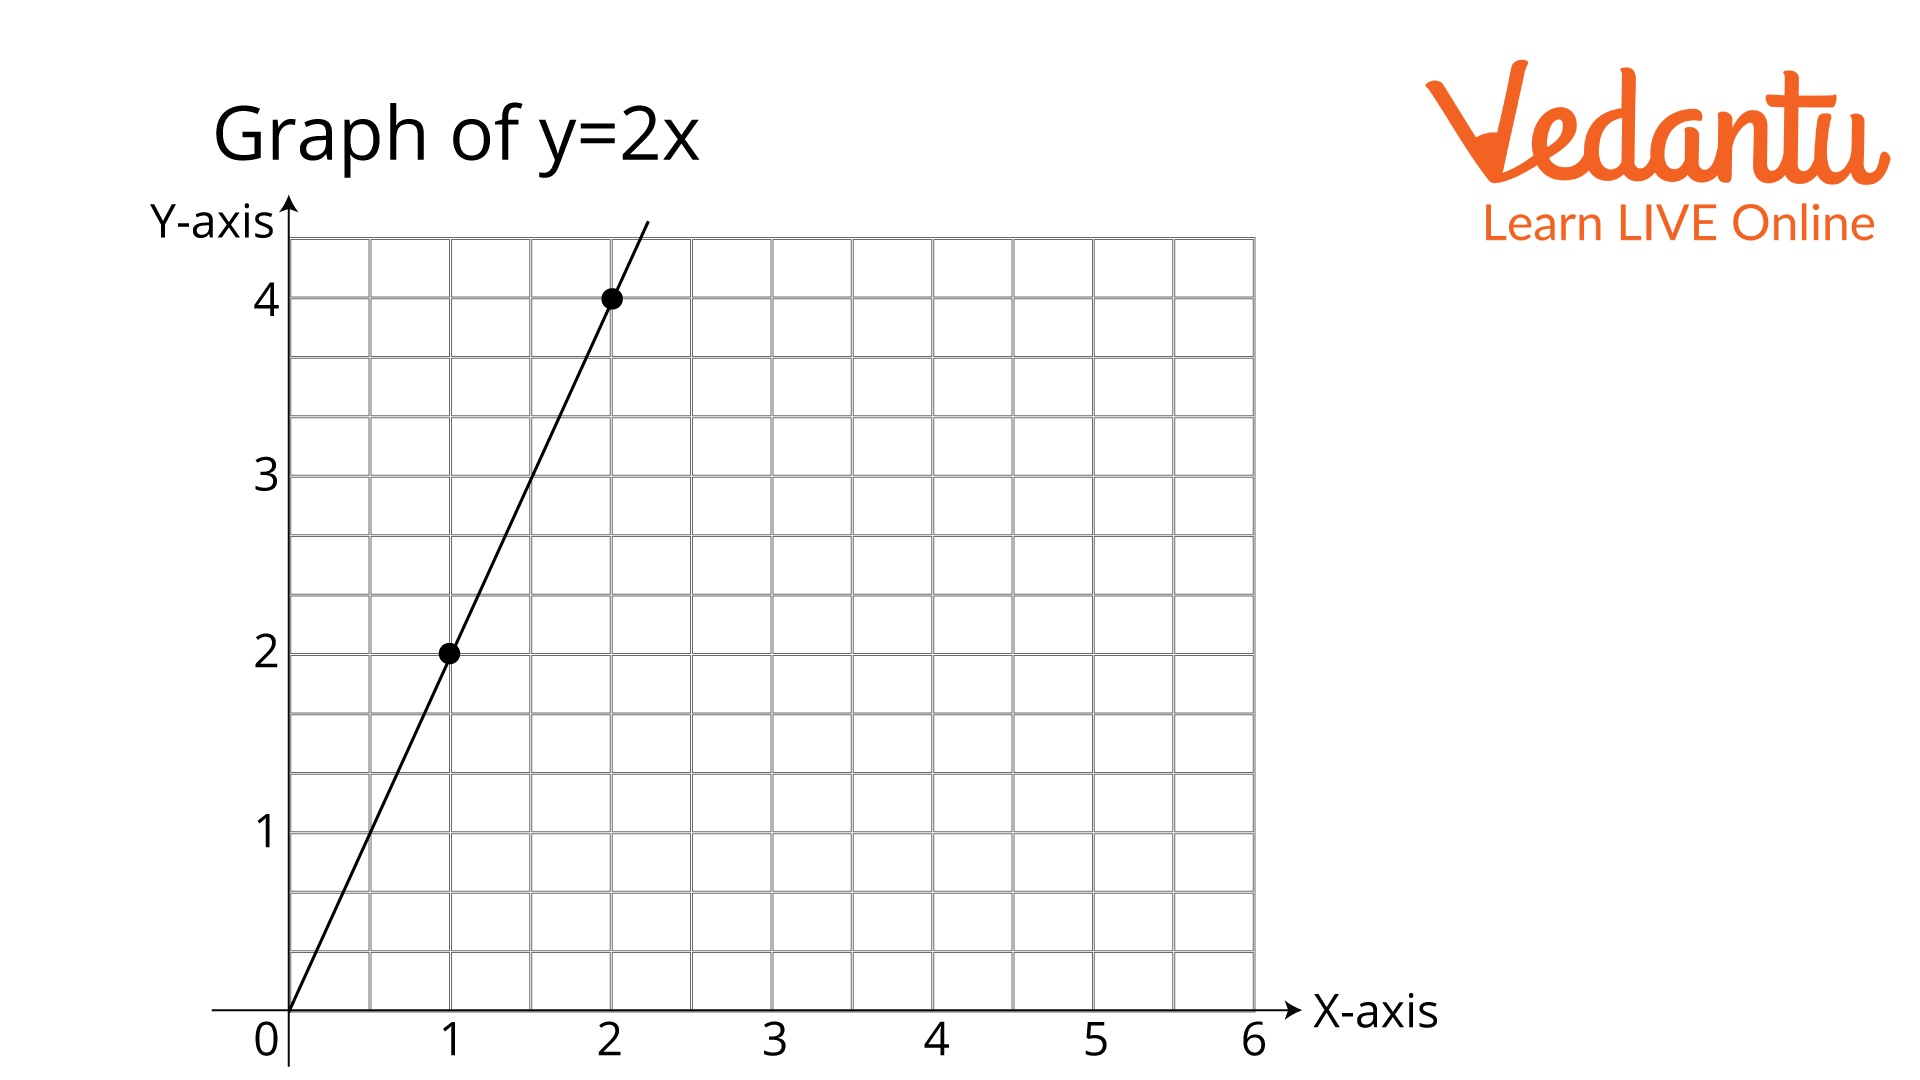
Graph of y=2x (self-made)
Conclusion
This is how you make a line graph. Wasn't it interesting to learn something new about data organisation? So, in this article, you learnt about graphs, graph types, and the two axes. You have also learnt the simple steps for drawing graphs with various data, which are to determine the variables, draw a table of the arranged data, and then draw the diagram. You have also learnt to take the scale of the graph into account when drawing one.
FAQs on How to Draw a Graph in Maths
1. What does it mean to draw a graph in Maths?
To draw a graph in Maths means to represent the relationship between two variables on a coordinate plane using points, lines, or curves. A graph visually shows how one quantity changes with another.
- Use the x-axis for the independent variable.
- Use the y-axis for the dependent variable.
- Plot ordered pairs in the form (x, y).
- Join the points if the relationship is continuous.
2. How do you draw a graph step by step?
To draw a graph step by step, you plot ordered pairs on the coordinate plane and connect them correctly. Follow these steps:
- Draw two perpendicular lines to form the x-axis and y-axis.
- Choose a suitable scale for both axes.
- Mark and label the axes clearly.
- Plot each ordered pair (x, y).
- Join the points with a straight line or smooth curve if required.
3. What is the formula used to draw a straight line graph?
The formula used to draw a straight line graph is y = mx + c, where m is the slope and c is the y-intercept. In this linear equation:
- m represents the rate of change (gradient).
- c is the point where the line crosses the y-axis.
4. How do you plot points on a graph?
To plot a point on a graph, move along the x-axis first and then vertically to the y-value. For an ordered pair (x, y):
- Move x units along the x-axis.
- From that point, move y units up (if positive) or down (if negative).
- Mark the location clearly.
5. What is the difference between a bar graph and a line graph?
The main difference is that a bar graph compares categories, while a line graph shows trends over continuous data. Key differences:
- Bar graphs use rectangular bars with gaps.
- Line graphs use connected points.
- Bar graphs are used for discrete data.
- Line graphs are used for continuous data like time.
6. How do you choose the correct scale when drawing a graph?
The correct scale is chosen by ensuring all data values fit clearly and evenly on the axes. Follow these guidelines:
- Identify the smallest and largest values.
- Divide the axis into equal intervals.
- Use simple intervals like 1, 2, 5, 10 units.
- Avoid overcrowding or excessive empty space.
7. What is the slope of a graph and how do you find it?
The slope of a graph measures the rate of change and is calculated using m = (y₂ − y₁) / (x₂ − x₁). It tells how steep a line is.
- Positive slope: line rises left to right.
- Negative slope: line falls left to right.
- Zero slope: horizontal line.
8. How do you draw a graph from a table of values?
To draw a graph from a table of values, plot each ordered pair from the table onto the coordinate plane. Steps:
- Write values as ordered pairs (x, y).
- Set up axes with an appropriate scale.
- Plot each pair carefully.
- Join the points if representing a function.
9. What are common mistakes when drawing graphs?
Common mistakes when drawing graphs include incorrect scaling, mislabeling axes, and plotting points inaccurately. Watch out for:
- Unequal intervals on axes.
- Forgetting to label x-axis and y-axis.
- Switching x and y coordinates.
- Not using a ruler for straight lines.
10. Why are graphs important in Maths?
Graphs are important in Maths because they visually represent relationships between variables and make patterns easier to understand. They help to:
- Identify trends and correlations.
- Compare data effectively.
- Interpret solutions of equations.
- Model real-life situations.