


How to Draw a Histogram with Formula and Solved Examples
The Histogram is a representation of the numerical data, not accurate but an estimate. Karl Pearson was the first one to introduce the idea of Histogram. To create the Histogram the first step is binning, which is also called data binning, or bucketing or discrete binning. In this step the data is pre-processed and used for reducing the effects of minor observation errors, it divides the whole range of values into a sequence of intervals, and then counts the number of values that falls into each of the intervals.
In a nutshell, Histogram helps in summarizing the continuous data. And hence, it is important for the students to learn about the same because it helps the students in understanding and interpreting the various types of data. But before everything, it is important to know about the Histogram in general.
Hence, Vedantu provides to the students of Mathematics the complete explanation of the Histogram, along with its definition, types, characteristics, parts and works, in a simple and lucid manner that all the students can easily understand.
Meaning of Histogram
A Histogram meaning can be stated as a graphical representation that condenses a data series into an easy interpretation of numerical data by grouping them into logical ranges of different heights which are also known as bins. Basically, it summarizes discrete or continuous data. We can also call it a frequence distribution graph as it is like a plot that lets you discover the underlying frequency distribution.
Histogram definition can be put forward as a tool that visualizes the distribution of data over a continuous interval or a certain time period. It helps us to get an estimate of where the values are concentrated, what are the extremes if there is any gap or unusual values. To some extent, a Histogram also gives us a brief view of a probability distribution. A Histogram is quite similar to a vertical bar graph but the difference that lies between them is that there is no gap between the bars in the Histogram, unlike a bar graph.
Histogram in Statistics
Histogram in statistics is a very important topic. Let’s understand it with an example. A container shows the number of information that focuses inside a reach (a stretch). Regularly, you pick the reach that best accommodates your information. A histogram chart is a bar chart representation of data. It is a representation of a series of results into columns along the x-axis. in the same histogram, the number of numbers or more occurrences in the data for each column is represented by the y-axis. It is the simplest method that can be used to visualize the distribution of data. Let's understand a histogram plot by plotting one for the example below.
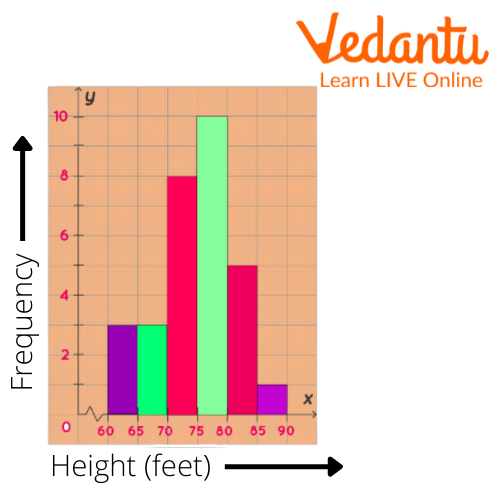
Histogram Graph Example
Parts of a Histogram.
Given below are the main part of the Histogram.
The Title: The title is the first and the foremost thing it describes all the information which is given in the Histogram.
X-axis: The intervals under which the measurement falls is shown in the X-axis intervals.
Y-axis: The values that occurred within the intervals set by the X-axis, is shown in the Y-axis.
The Bars: The bars are used for showing the value of the data. And for knowing the total number of times the values occurred within the interval, the height of the bar is helpful, while the interval that is covered is shown by the width of the bar. And hence, it is obvious that the Histogram which has all the bins equal must have the width same as well, across all the bars.
How Histogram Works
In statistics Histograms, for the most part, are used widely because it shows how many of a specific type of variable occurs within a certain range. That is to say, it helps in showing the data or the numbers in graphical format and hence makes it much easier for us to understand and interpret the data.
Histograms can work and serve so many different purposes, such as from the census, Histogram can be used for showing the range of people between eh certain age, such as how many people are there in the country between the age of 10 and 20 etc. In many various operations, Histograms are useful.
Also, if you wish to know about the Bar Graph and Histogram, because more often than not both are confused with each other, you may find this link helpful: Bar Graphs and Histogram – Definition, Types, Uses and Key Difference (vedantu.com)
Characteristics of a Histogram
A Histogram is used to display continuous data in a categorical form.
In a Histogram, there are no gaps between the bars, unlike a bar graph.
The width of the bins is equal.
It is the Area, Not the Height of the Bars
In a Histogram, it is the area and not the height of the bar that indicates the frequency of occurrences for each bin. The height of the bar does not indicate how many occurrences of scores are there in each individual bin. It is always the product of the height and width of the bin that indicates the frequency of occurrences within that bin.
How to Create a Frequency Histogram Graph
To construct a Histogram graph from a continuous variable there are a few steps that we need to follow. They are given below;
Step 1) Firstly, we need to split the data into class intervals which are also known as bins and frequencies.
Step 2) In this step, we have to draw a Histogram graph with X-axis and Y-axis. Then write down the class intervals on the X-axis and the frequencies on the Y-axis.
Step 3) Draw vertical rectangles using the X-axis and the Y-axis.
Difference between Bar Graph And Histogram
A Histogram can be represented in different ways. Some of them are given below with the Histogram example as well.
Types of Histograms
The table above will not only teach you the different types of histograms but also how to draw a histogram.
Summary
A histogram is a graphical representation of data points organized into user-specified ranges. Similar in appearance to a bar graph, the histogram condenses a data series into an easily interpreted visual by taking many data points and grouping them into logical ranges or bins. It is frequently used to easily depict the main characteristics of the data distribution.
FAQs on Histogram in Statistics Explained Clearly
1. What is a histogram in statistics?
A histogram is a graphical representation of the distribution of numerical data using adjacent bars to show frequency. It displays how data is grouped into class intervals (bins) on the horizontal axis and their corresponding frequencies on the vertical axis.
- Used for continuous data
- Bars touch each other (no gaps)
- Shows shape of data such as symmetric, skewed, or uniform
2. How is a histogram different from a bar graph?
The main difference is that a histogram represents continuous data with touching bars, while a bar graph represents categorical data with separated bars.
- Histogram: continuous numerical intervals
- Bar graph: categories or discrete data
- Histogram bars touch; bar graph bars have gaps
3. How do you construct a histogram step by step?
To construct a histogram, group data into class intervals and draw adjacent bars based on frequency.
- Step 1: Organize data in ascending order
- Step 2: Choose suitable class intervals
- Step 3: Count frequency for each interval
- Step 4: Draw intervals on x-axis and frequency on y-axis
- Step 5: Draw touching bars for each class
4. What is the formula for class width in a histogram?
The class width is calculated using the formula Class Width = (Maximum Value − Minimum Value) ÷ Number of Classes.
- Example: Data range 10 to 50
- Range = 50 − 10 = 40
- If 5 classes, class width = 40 ÷ 5 = 8
5. What does the height of a histogram bar represent?
The height of a histogram bar represents the frequency (or frequency density) of data within that class interval. In simple histograms with equal class widths, height equals frequency. For unequal class widths, height represents frequency density = frequency ÷ class width.
6. Can you give an example of a histogram?
A histogram example shows grouped test scores displayed as adjacent bars based on frequency.
- Scores 0–10: 2 students
- Scores 10–20: 5 students
- Scores 20–30: 8 students
- Scores 30–40: 5 students
7. What is frequency density in a histogram?
Frequency density is calculated as Frequency Density = Frequency ÷ Class Width and is used when class intervals are unequal. It ensures that the area of each bar correctly represents the data frequency.
- Example: Frequency = 10
- Class width = 5
- Frequency density = 10 ÷ 5 = 2
8. Why do histogram bars touch each other?
Histogram bars touch because they represent continuous data where there are no gaps between class intervals. Since numerical intervals follow one another without breaks, the bars are drawn adjacent to show continuity.
9. What does the shape of a histogram tell you?
The shape of a histogram shows the distribution pattern of data, such as symmetry or skewness.
- Symmetric: left and right sides mirror each other
- Right-skewed: tail extends to the right
- Left-skewed: tail extends to the left
- Uniform: bars have similar heights
10. What are common mistakes when drawing a histogram?
Common histogram mistakes include incorrect class intervals and leaving gaps between bars.
- Using unequal intervals without frequency density
- Leaving spaces between bars
- Incorrect scaling on axes
- Mixing categorical data instead of continuous data