


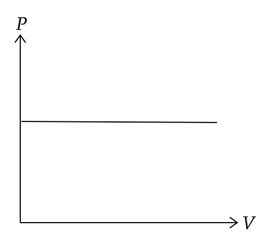
Which of the following processes is correct for a given P-V diagram?
A) Adiabatic process
B) Isothermal process
C) Isobaric process
D) Isochoric process
Answer
232.8k+ views
Hint: The curve given to us is a P-V curve. It represents the changes in pressure and volume for a gas in a container of fixed volume, free to be compressed and to expand. There are other curves such as the P-T curve that represents the variations in pressure and temperature, and V-T curve that represent the changes between volume and temperature of the gas.
Complete step by step solution:
In the given figure, the line is parallel to the x-axis, which implies that the quantity given on the y-axis is constant for any variation in the quantity given on the x-axis. The quantity on the y-axis is pressure. This implies that the given curve represents a process in which there is no pressure change or the pressure remains constant throughout.
Such a thermodynamic process is called an isobaric process. A very common example of an isobaric process is cooking in an open vessel, such as we do in our kitchen. The pressure over an open vessel is always equal to the atmospheric pressure and is thus constant. The volume might decrease or increase, this means that the line can progress towards the positive x-axis and the negative x-axis, but it will always remain parallel to the x-axis with the same y-intercept.
Hence, option (C) is the correct answer.
Note: If we plot other graphs for isobaric processes, with variations between other physical quantities, we’ll get different results. A graph between the temperature and the volume for an isobaric process will give us a straight line passing through the origin. This shows that variations in other quantities are different from the variation in pressure or volume for any thermodynamic process.
Recently Updated Pages
JEE Main 2023 April 6 Shift 1 Question Paper with Answer Key
JEE Main 2023 April 6 Shift 2 Question Paper with Answer Key
JEE Main 2023 (January 31 Evening Shift) Question Paper with Solutions [PDF]
JEE Main 2023 January 30 Shift 2 Question Paper with Answer Key
JEE Main 2023 January 25 Shift 1 Question Paper with Answer Key
JEE Main 2023 January 24 Shift 2 Question Paper with Answer Key
Trending doubts
JEE Main 2026: Session 2 Registration Open, City Intimation Slip, Exam Dates, Syllabus & Eligibility
JEE Main 2026 Application Login: Direct Link, Registration, Form Fill, and Steps
Understanding the Angle of Deviation in a Prism
Hybridisation in Chemistry – Concept, Types & Applications
How to Convert a Galvanometer into an Ammeter or Voltmeter
Understanding Uniform Acceleration in Physics
Other Pages
JEE Advanced Marks vs Ranks 2025: Understanding Category-wise Qualifying Marks and Previous Year Cut-offs
Laws of Motion Class 11 Physics Chapter 4 CBSE Notes - 2025-26
Waves Class 11 Physics Chapter 14 CBSE Notes - 2025-26
Mechanical Properties of Fluids Class 11 Physics Chapter 9 CBSE Notes - 2025-26
Thermodynamics Class 11 Physics Chapter 11 CBSE Notes - 2025-26
Units And Measurements Class 11 Physics Chapter 1 CBSE Notes - 2025-26