


Which of the following graphs gives the equation \[x = {v_0} + \dfrac{1}{2}a{t^2}\]
A. 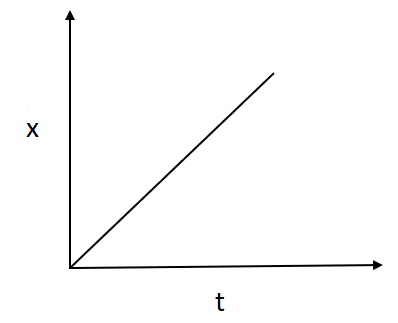
B. 
C. 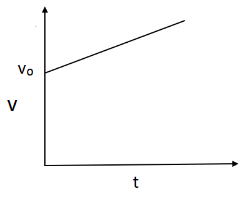
D. None of these
Answer
233.1k+ views
Hint:The second equation of motion gives the total distance covered by an object which is moving with uniform acceleration. To solve this question, we need to define the velocity-time graphs using the variation of velocity. To draw a v-t graph, the area under it is defined as the distance.
Complete step by step solution:
A velocity-time graph represents the variation of velocity of a moving particle with respect to the time taken. For the accelerated motion, the line will not be parallel to the x-axis as well as the y-axis. For another graph that is with zero acceleration, the line will be parallel to the X axis or we can say that time axis.

This graph represents a velocity-time graph for the accelerated motion.
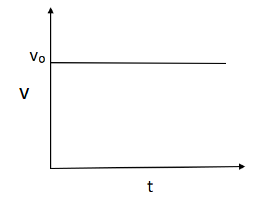
This represents the velocity-time graph for the accelerated motion and for the motion for zero acceleration.
Now look at this graph,
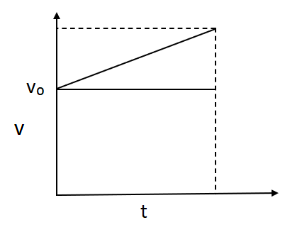
As we know that the distance covered by a body is equal to the enclosed area under that graph,
Hence option C is the correct answer
Note: A velocity-time graph or v-t graph shows the speed as well as the direction an object travels over a specific period of time. Velocity-time graphs are also known as speed-time graphs. The y-axis or vertical axis of a velocity-time graph is the velocity of the object and the x-axis or horizontal axis of a velocity-time graph is the time of the object.
Complete step by step solution:
A velocity-time graph represents the variation of velocity of a moving particle with respect to the time taken. For the accelerated motion, the line will not be parallel to the x-axis as well as the y-axis. For another graph that is with zero acceleration, the line will be parallel to the X axis or we can say that time axis.
This graph represents a velocity-time graph for the accelerated motion.
This represents the velocity-time graph for the accelerated motion and for the motion for zero acceleration.
Now look at this graph,
As we know that the distance covered by a body is equal to the enclosed area under that graph,
Hence option C is the correct answer
Note: A velocity-time graph or v-t graph shows the speed as well as the direction an object travels over a specific period of time. Velocity-time graphs are also known as speed-time graphs. The y-axis or vertical axis of a velocity-time graph is the velocity of the object and the x-axis or horizontal axis of a velocity-time graph is the time of the object.
Recently Updated Pages
JEE Main 2023 April 6 Shift 1 Question Paper with Answer Key
JEE Main 2023 April 6 Shift 2 Question Paper with Answer Key
JEE Main 2023 (January 31 Evening Shift) Question Paper with Solutions [PDF]
JEE Main 2023 January 30 Shift 2 Question Paper with Answer Key
JEE Main 2023 January 25 Shift 1 Question Paper with Answer Key
JEE Main 2023 January 24 Shift 2 Question Paper with Answer Key
Trending doubts
JEE Main 2026: Session 2 Registration Open, City Intimation Slip, Exam Dates, Syllabus & Eligibility
JEE Main 2026 Application Login: Direct Link, Registration, Form Fill, and Steps
Understanding the Angle of Deviation in a Prism
Hybridisation in Chemistry – Concept, Types & Applications
How to Convert a Galvanometer into an Ammeter or Voltmeter
Understanding Uniform Acceleration in Physics
Other Pages
JEE Advanced Marks vs Ranks 2025: Understanding Category-wise Qualifying Marks and Previous Year Cut-offs
Laws of Motion Class 11 Physics Chapter 4 CBSE Notes - 2025-26
Waves Class 11 Physics Chapter 14 CBSE Notes - 2025-26
Mechanical Properties of Fluids Class 11 Physics Chapter 9 CBSE Notes - 2025-26
Thermodynamics Class 11 Physics Chapter 11 CBSE Notes - 2025-26
Units And Measurements Class 11 Physics Chapter 1 CBSE Notes - 2025-26