


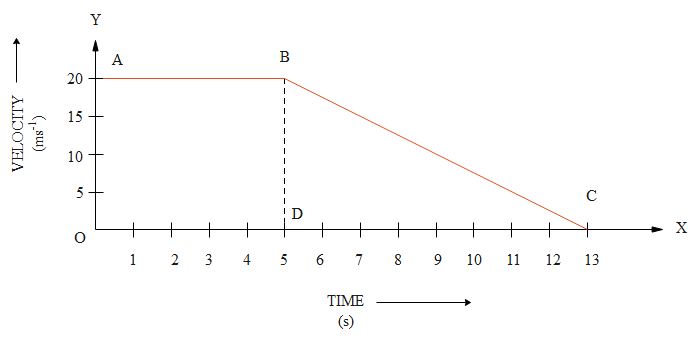
The velocity – time graph of a car moving on a straight road is shown: Calculate the acceleration of the car during the last 8 seconds:
(A) $ - 2.5m/{s^{ - 2}}$
(B) $ - 1.5m/{s^{ - 2}}$
(C) $0$
(D) Cannot be determined from the given plot
Answer
256.2k+ views
Hint: To answer this question we need to consider the acceleration of the car at every part of the graph. The graph is to be divided in sections as per the diagram and on the basis of the coordinates covered by the graph, we have to determine the acceleration. The time coordinate will help us to find the acceleration of the car specifically for the last 8 seconds.
Complete step by step answer:
We should know the formula of finding the acceleration.
The acceleration of the car will be given as the distance covered divided by the time taken.
From the graph we can determine that the acceleration of the car in the last 8 seconds will be given by the slope of the line BC.
To find the slope of BC we can write it as: $\dfrac{{BD}}{{CD}}$
From the graph we can put the values as:
$\dfrac{{(0 - 20)}}{{(13 - 5)}} = \dfrac{{ - 20}}{8} = - 2.5m{s^{ - 2}}$
So we can say that the acceleration of the car in the last 8 seconds is $ - 2.5m/{s^{ - 2}}$.
Hence Option A is correct.
Note: To avoid any difficulty while solving such type of questions we should be knowing that, we need to consider the part of the graph covered by the line of the object in the distance coordinate and time coordinate. The acceleration can be negative as well as positive depending on the slope of the line which depicts the movement of the object.
Recently Updated Pages
Electricity and Magnetism Explained: Key Concepts & Applications
JEE Energetics Important Concepts and Tips for Exam Preparation
JEE Isolation, Preparation and Properties of Non-metals Important Concepts and Tips for Exam Preparation
JEE Main 2023 (February 1st Shift 1) Maths Question Paper with Answer Key
JEE Main 2023 (February 1st Shift 2) Maths Question Paper with Answer Key
JEE Main 2023 (February 1st Shift 2) Chemistry Question Paper with Answer Key
Trending doubts
JEE Main 2026: Exam Dates, Session 2 Updates, City Slip, Admit Card & Latest News
JEE Main Participating Colleges 2026 - A Complete List of Top Colleges
JEE Main 2026 Application Login: Direct Link, Registration, Form Fill, and Steps
JEE Main Colleges 2026: Complete List of Participating Institutes
JEE Main Marking Scheme 2026- Paper-Wise Marks Distribution and Negative Marking Details
Hybridisation in Chemistry – Concept, Types & Applications
Other Pages
JEE Advanced 2026 - Exam Date (Released), Syllabus, Registration, Eligibility, Preparation, and More
JEE Advanced Marks vs Ranks 2025: Understanding Category-wise Qualifying Marks and Previous Year Cut-offs
CBSE Notes Class 11 Physics Chapter 1 - Units And Measurements - 2025-26
NCERT Solutions For Class 11 Physics Chapter 1 Units And Measurements - 2025-26
Important Questions For Class 11 Physics Chapter 1 Units and Measurement - 2025-26
JEE Advanced Weightage 2025 Chapter-Wise for Physics, Maths and Chemistry