


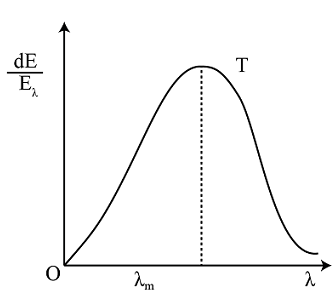
The figure shows a radiant energy spectrum graph for a black body at a temperature T. Identify the graph which correctly represents the spectral intensity versus wavelength graph at two temperatures $\mathrm{T}^{\prime}$ and $\mathrm{T}\left(\mathrm{T}<\mathrm{T}^{\prime}\right)$ :
A. 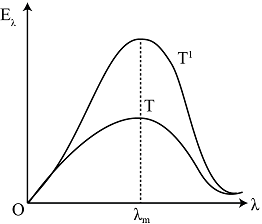
B. 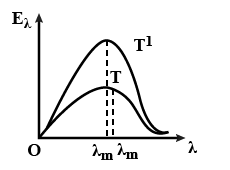
C. 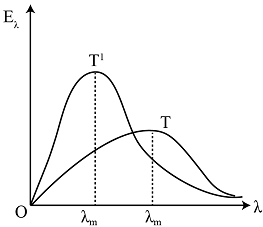
D. None of these
Answer
252k+ views
Hint: Find the proper diagram from the graphs provided here, which show the spectral intensity versus wavelength at two different temperatures and the radiant energy spectrum for a blackbody. You must identify the idea that may be utilized to calculate the variation in intensity with respect to wavelength of the radiation emitted by the blackbody at various temperatures in order to respond to this question.
Complete step by step solution:
Once released by any body, thermal radiations become electromagnetic waves similar to light and are subject to all the principles of wave theory. The laws of geometrical optics, such as that radiation travels in a straight line, shadows are cast, reflection and refraction also occur at the boundary of two media, are valid since the wavelength is comparable to the sizes of commonly used objects. The explanation above served as a primer on radiation and to inform you that since radiations are essentially electromagnetic waves, it is inevitable that each wave would have a specific wavelength.
A body's radiation is made up of a variety of waves of varied wavelengths, but only a specific range of wavelengths is significant in terms of its contribution to the radiation. The wavelength is greatly influenced by the temperature of the emitting substance. The graph of intensity versus wavelength is used to investigate the nature of thermal radiation.
According to this, the wavelength that corresponds to the greatest intensity shifts to the left as the temperature rises, which means that the wavelength decreases. As a result, the second graph is the one that accurately represents the spectral intensity versus wavelength graph.
Therefore, the correct answer is option B.
Note: The important thing to note is that, although our discussion of the conditions was brief, option (C) also satisfies them. Option (C) is erroneous since it is impossible for the curve with temperature $T$ to be greater than the curve with temperature $T^{\prime}$. Always place the curve with high temperature above the curve with relatively low temperature.
Recently Updated Pages
States of Matter Chapter For JEE Main Chemistry
JEE Main Participating Colleges 2026 - A Complete List of Top Colleges
Circuit Switching vs Packet Switching: Key Differences Explained
Mass vs Weight: Key Differences Explained for Students
[Awaiting the three content sources: Ask AI Response, Competitor 1 Content, and Competitor 2 Content. Please provide those to continue with the analysis and optimization.]
JEE Isolation, Preparation and Properties of Non-metals Important Concepts and Tips for Exam Preparation
Trending doubts
JEE Main 2026: Exam Dates, Session 2 Updates, City Slip, Admit Card & Latest News
JEE Main Marking Scheme 2026- Paper-Wise Marks Distribution and Negative Marking Details
Hybridisation in Chemistry – Concept, Types & Applications
JEE Main 2026 Application Login: Direct Link, Registration, Form Fill, and Steps
Understanding the Electric Field of a Uniformly Charged Ring
Derivation of Equation of Trajectory Explained for Students
Other Pages
JEE Advanced 2026 - Exam Date (Released), Syllabus, Registration, Eligibility, Preparation, and More
JEE Advanced Marks vs Ranks 2025: Understanding Category-wise Qualifying Marks and Previous Year Cut-offs
CBSE Notes Class 11 Physics Chapter 1 - Units And Measurements - 2025-26
Important Questions For Class 11 Physics Chapter 1 Units and Measurement - 2025-26
NCERT Solutions For Class 11 Physics Chapter 1 Units And Measurements - 2025-26
CBSE Notes Class 11 Physics Chapter 4 - Laws of Motion - 2025-26