


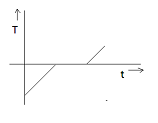
If specific heat capacity of a substance in solid and liquid state is proportional to temperature of the substance then it heat is supplied to the solid initially at $ - {20^ \circ }C$ (having melting point ${0^ \circ }C$ ) at constant rate. Then the temperature dependence of solid with time will be best represented by:
A)
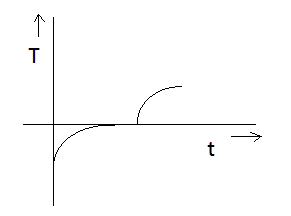
B)
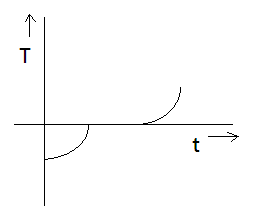
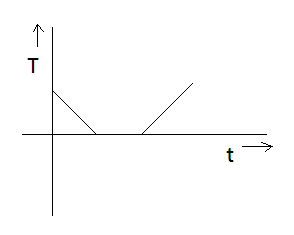
C)
D)
Answer
258k+ views
Hint: We have to obtain a relation in Temperature (T) and time (t) from the given information. The solid is initially at $ - {20^ \circ }C$ hence, the solution graph must also have temperature in negative. Using this information, we can eliminate option D. Use the thermodynamic equation for specific heat. Heat is supplied at constant rate and specific heat capacity is proportional to temperature.
Complete step by step solution:
As we have discussed in the hint, we have to obtain a relation in temperature and time. Let’s first note down the given information. It makes it easier to solve the question.
The given information is:
i) Specific heat capacity is proportional to temperature:
$ \Rightarrow S \propto {\rm T}$ where $S$ is the specific heat capacity and $T$ is temperature
Let there be a constant of proportionality ${K_1}$ , now we have
\[S = {K_1}T\] --equation \[1\]
ii) The heat is supplied at a constant rate:
\[ \Rightarrow \dfrac{{dQ}}{{dt}} = constant\] where \[dQ\] is the amount of heat supplied and \[dt\] is the change in time
Let this constant be \[C\] :
\[ \Rightarrow \dfrac{{dQ}}{{dt}} = C\] --equation \[2\]
Now, we have equations of rate of heat supplied and specific heat capacity. We have variables of temperature and time in them. Now we need to think of an equation which combines them.
The equation which relates them is as follows:
\[dQ = mSdT\] --equation \[3\]
Where \[dQ\] is the amount of heat energy required to raise the temperature of a substance by \[dT\] degrees.
\[ \Rightarrow \dfrac{C}{{m{K_1}}} = T\dfrac{{dT}}{{dt}}\] is the mass of the substance.
If we divide equation \[3\] by \[dt\] we can have the left hand side of the equation is equal to that of equation \[2\] .
Thus, dividing equation \[3\] by \[dt\] , we have:
\[\dfrac{{dQ}}{{st}} = mS\dfrac{{dT}}{{dt}}\]
Also, from equation \[1\] we can substitute the value of specific heat as follows:
\[ \Rightarrow \dfrac{{dQ}}{{st}} = m({K_1}T)\dfrac{{dT}}{{dt}}\]
But we have rate of heat transfer is constant, from equation \[2\] :
\[ \Rightarrow C = m({K_1}T)\dfrac{{dT}}{{dt}}\]
Here we have an equation in temperature and time. But the temperature and time are in differential form, we will have to integrate them. In order to integrate, we will have to take constant terms on one side.
\[ \Rightarrow \dfrac{C}{{m{K_1}}} = T\dfrac{{dT}}{{dt}}\]
As you can see the left-hand side, we have only constants. After rearranging the equation, we have:
\[ \Rightarrow \dfrac{C}{{m{K_1}}}dt = TdT\]
Let the constant, \[\dfrac{C}{{m{K_1}}} = P\] where \[P\] is also a constant.
This simplifies our equation as follows:
\[ \Rightarrow Pdt = TdT\]
Now, we have a relation in time and temperature.
We will have to integrate this equation from time \[0\,to\,t\] and temperature \[ - {20^ \circ }C\,to\,{T^0}C\]
\[ \Rightarrow P\int {dt} = \int {TdT} \]
\[ \Rightarrow Pt = \dfrac{{{T^2}}}{2} + {C_0}\]Where \[{C_0}\] is constant of proportionality.
Here, we can put values of temperature and observe but that is not needed.
The given graph is of temperature versus time and our relation in temperature and time is of the following nature.
\[T = \sqrt t \] which is similar to \[y = \sqrt x \] .
From the above discussion, it is clear that the graph cannot be linear. Therefore, option A is also eliminated.
The graph of \[y = \sqrt x \] is of the form:
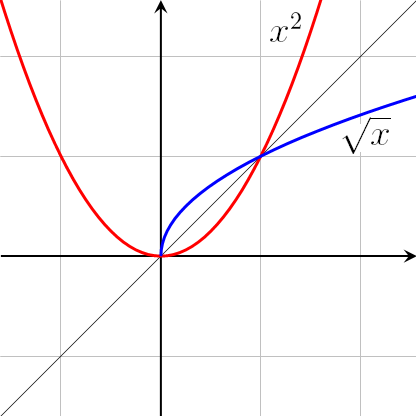
The blue curve denotes the required graph which is similar to option C.
Thus, Option (C) is the correct option.
Note: Remember all the steps in this question. The graph in option C is not uniform as at ${0^ \circ }C$ the substance will change to liquid state from solid state (as given in question). After this the graph will again be uniform.
Complete step by step solution:
As we have discussed in the hint, we have to obtain a relation in temperature and time. Let’s first note down the given information. It makes it easier to solve the question.
The given information is:
i) Specific heat capacity is proportional to temperature:
$ \Rightarrow S \propto {\rm T}$ where $S$ is the specific heat capacity and $T$ is temperature
Let there be a constant of proportionality ${K_1}$ , now we have
\[S = {K_1}T\] --equation \[1\]
ii) The heat is supplied at a constant rate:
\[ \Rightarrow \dfrac{{dQ}}{{dt}} = constant\] where \[dQ\] is the amount of heat supplied and \[dt\] is the change in time
Let this constant be \[C\] :
\[ \Rightarrow \dfrac{{dQ}}{{dt}} = C\] --equation \[2\]
Now, we have equations of rate of heat supplied and specific heat capacity. We have variables of temperature and time in them. Now we need to think of an equation which combines them.
The equation which relates them is as follows:
\[dQ = mSdT\] --equation \[3\]
Where \[dQ\] is the amount of heat energy required to raise the temperature of a substance by \[dT\] degrees.
\[ \Rightarrow \dfrac{C}{{m{K_1}}} = T\dfrac{{dT}}{{dt}}\] is the mass of the substance.
If we divide equation \[3\] by \[dt\] we can have the left hand side of the equation is equal to that of equation \[2\] .
Thus, dividing equation \[3\] by \[dt\] , we have:
\[\dfrac{{dQ}}{{st}} = mS\dfrac{{dT}}{{dt}}\]
Also, from equation \[1\] we can substitute the value of specific heat as follows:
\[ \Rightarrow \dfrac{{dQ}}{{st}} = m({K_1}T)\dfrac{{dT}}{{dt}}\]
But we have rate of heat transfer is constant, from equation \[2\] :
\[ \Rightarrow C = m({K_1}T)\dfrac{{dT}}{{dt}}\]
Here we have an equation in temperature and time. But the temperature and time are in differential form, we will have to integrate them. In order to integrate, we will have to take constant terms on one side.
\[ \Rightarrow \dfrac{C}{{m{K_1}}} = T\dfrac{{dT}}{{dt}}\]
As you can see the left-hand side, we have only constants. After rearranging the equation, we have:
\[ \Rightarrow \dfrac{C}{{m{K_1}}}dt = TdT\]
Let the constant, \[\dfrac{C}{{m{K_1}}} = P\] where \[P\] is also a constant.
This simplifies our equation as follows:
\[ \Rightarrow Pdt = TdT\]
Now, we have a relation in time and temperature.
We will have to integrate this equation from time \[0\,to\,t\] and temperature \[ - {20^ \circ }C\,to\,{T^0}C\]
\[ \Rightarrow P\int {dt} = \int {TdT} \]
\[ \Rightarrow Pt = \dfrac{{{T^2}}}{2} + {C_0}\]Where \[{C_0}\] is constant of proportionality.
Here, we can put values of temperature and observe but that is not needed.
The given graph is of temperature versus time and our relation in temperature and time is of the following nature.
\[T = \sqrt t \] which is similar to \[y = \sqrt x \] .
From the above discussion, it is clear that the graph cannot be linear. Therefore, option A is also eliminated.
The graph of \[y = \sqrt x \] is of the form:
The blue curve denotes the required graph which is similar to option C.
Thus, Option (C) is the correct option.
Note: Remember all the steps in this question. The graph in option C is not uniform as at ${0^ \circ }C$ the substance will change to liquid state from solid state (as given in question). After this the graph will again be uniform.
Recently Updated Pages
Circuit Switching vs Packet Switching: Key Differences Explained
Dimensions of Pressure in Physics: Formula, Derivation & SI Unit
JEE General Topics in Chemistry Important Concepts and Tips
JEE Extractive Metallurgy Important Concepts and Tips for Exam Preparation
JEE Atomic Structure and Chemical Bonding important Concepts and Tips
JEE Amino Acids and Peptides Important Concepts and Tips for Exam Preparation
Trending doubts
JEE Main 2026: Exam Dates, Session 2 Updates, City Slip, Admit Card & Latest News
JEE Main Participating Colleges 2026 - A Complete List of Top Colleges
JEE Main 2026 Application Login: Direct Link, Registration, Form Fill, and Steps
JEE Main Colleges 2026: Complete List of Participating Institutes
JEE Main Marking Scheme 2026- Paper-Wise Marks Distribution and Negative Marking Details
Hybridisation in Chemistry – Concept, Types & Applications
Other Pages
JEE Advanced 2026 - Exam Date (Released), Syllabus, Registration, Eligibility, Preparation, and More
JEE Advanced Marks vs Ranks 2025: Understanding Category-wise Qualifying Marks and Previous Year Cut-offs
CBSE Notes Class 11 Physics Chapter 1 - Units And Measurements - 2025-26
NCERT Solutions For Class 11 Physics Chapter 1 Units And Measurements - 2025-26
Important Questions For Class 11 Physics Chapter 1 Units and Measurement - 2025-26
JEE Advanced Weightage 2025 Chapter-Wise for Physics, Maths and Chemistry