


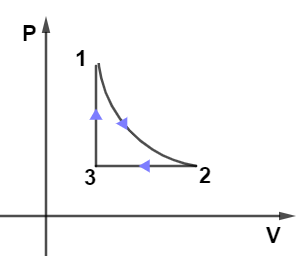
For the given P-V graph of an ideal gas, chose the correct V-T graph. Process $1 \rightarrow 2$ is adiabatic. (Graphs are schematic and not to scale).
(A) 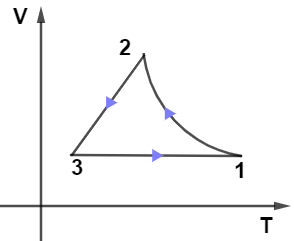
(B)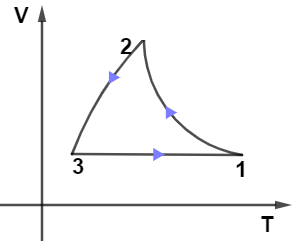
(C)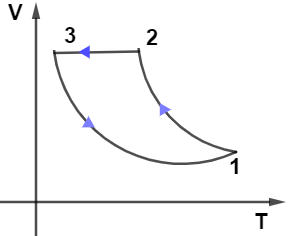
(D)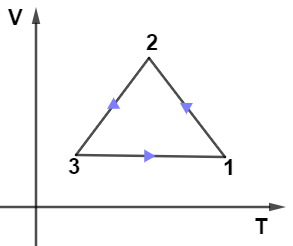
Answer
258.6k+ views
Hint: In order to solve this question, we will observe the each path of the given PV diagram cycle, and then using concepts of constant pressure, constant temperature, and constant volume and with an understanding of linear and non-linear graphs we will match the correct graph for the representation of VT diagram of same corresponding PV diagram.
Complete answer:
From the given PV diagram let us observe the path $2 \rightarrow 3$ which is kept at constant pressure as we know at constant pressure-volume is directly proportional to the temperature which means the graph for path $2 \rightarrow 3$ will be a straight line passing through the origin, so only graph in given options (B) and (D) have this condition.
Now, on observing the path $1 \rightarrow 3$ from the PV diagram we see that it’s kept at the constant volume it means in the VT diagram path $1 \rightarrow 3$ must be kept at a constant volume so from options only (B) and (D have this condition.
Now, the last path $1 \rightarrow 2$ in the PV diagram is adiabatic so in the VT diagram it can’t be a straight line it must a curve, only option (A) fulfills this condition.
Hence, option (A) is the correct answer.
Note: It should be remembered that when the volume is directly proportional to temperature the equation becomes $V = kT$ which is an equation of a straight line passing through origin and adiabatic processes have curved graph because of the equation $P{V^{\gamma} } = K$.
Recently Updated Pages
Circuit Switching vs Packet Switching: Key Differences Explained
Dimensions of Pressure in Physics: Formula, Derivation & SI Unit
JEE General Topics in Chemistry Important Concepts and Tips
JEE Extractive Metallurgy Important Concepts and Tips for Exam Preparation
JEE Atomic Structure and Chemical Bonding important Concepts and Tips
JEE Amino Acids and Peptides Important Concepts and Tips for Exam Preparation
Trending doubts
JEE Main 2026: Exam Dates, Session 2 Updates, City Slip, Admit Card & Latest News
JEE Main Participating Colleges 2026 - A Complete List of Top Colleges
JEE Main Marking Scheme 2026- Paper-Wise Marks Distribution and Negative Marking Details
Hybridisation in Chemistry – Concept, Types & Applications
Understanding the Electric Field of a Uniformly Charged Ring
Derivation of Equation of Trajectory Explained for Students
Other Pages
JEE Advanced 2026 - Exam Date (Released), Syllabus, Registration, Eligibility, Preparation, and More
JEE Advanced Marks vs Ranks 2025: Understanding Category-wise Qualifying Marks and Previous Year Cut-offs
CBSE Notes Class 11 Physics Chapter 1 - Units And Measurements - 2025-26
NCERT Solutions For Class 11 Physics Chapter 1 Units And Measurements - 2025-26
Important Questions For Class 11 Physics Chapter 1 Units and Measurement - 2025-26
JEE Advanced Weightage 2025 Chapter-Wise for Physics, Maths and Chemistry