


How Does the Lothar Meyer Curve Explain Periodic Trends in Atomic Volume?
The Lothar Meyer Curve is a key concept in JEE Main Chemistry, offering insight into the periodic trends of elements through a graphical representation of atomic volume against atomic number. Understanding this curve not only clarifies the history of the periodic table, but also helps students solve MCQs and assertion-reason questions involving periodicity, element classification, and the comparison of Meyer’s and Mendeleev’s approaches.
Definition and Importance of the Lothar Meyer Curve
The Lothar Meyer Curve shows how atomic volume changes as atomic number increases across the elements. By plotting atomic volume (cm3/mol) on the y-axis versus atomic number on the x-axis, Lothar Meyer revealed a repeating (periodic) trend that reflects why elements with similar properties recur at regular intervals. This was an early foundation for understanding periodicity, now central to modern chemistry and JEE.
Historical Evolution: Lothar Meyer’s Contribution
Julius Lothar Meyer was a German chemist whose work paralleled that of Mendeleev in the 19th century. Meyer’s research focused on physical properties like atomic volume, revealing regularities and periodic trends. His 1869 atomic volume curve was among the first graphical methods to support classifying elements by periodicity, laying groundwork for today’s periodic law.
- Meyer first published a periodic table in 1862 (28 elements); expanded to 50 elements by 1864.
- He plotted atomic volume versus atomic mass/number, seeing periodic peaks and troughs.
- While Mendeleev predicted undiscovered elements, Meyer’s strength was in revealing periodic trends graphically.
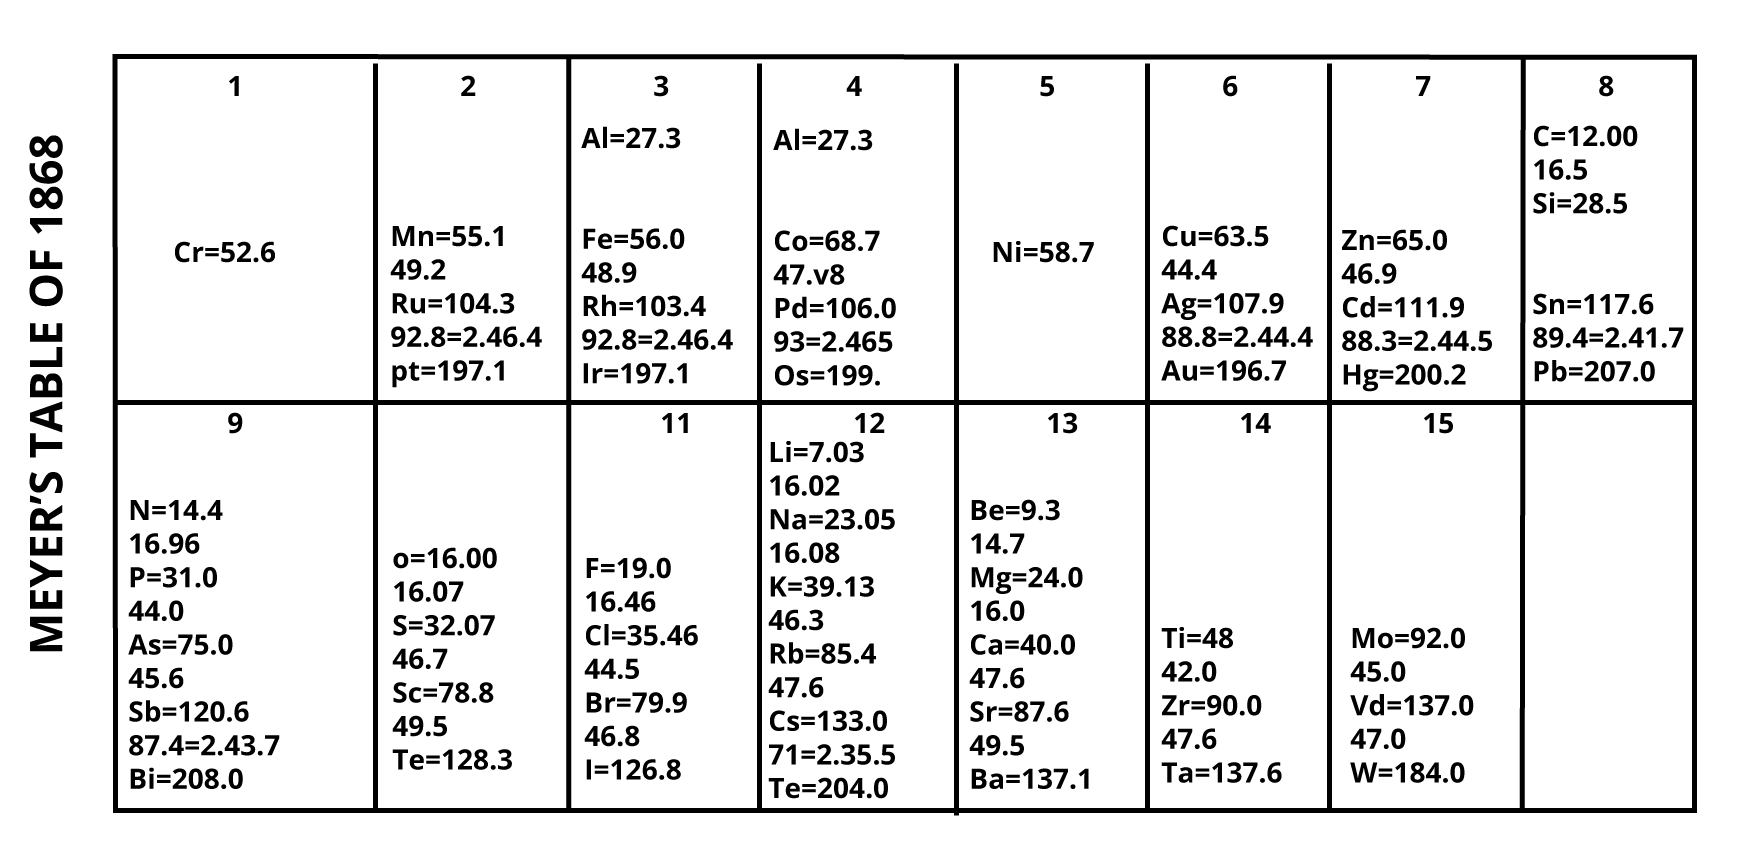
Lothar Meyer Periodic Table Published in 1895 represented periodicity visually and bolstered the case for classifying elements by recurring trends.
Graphical Explanation: How the Lothar Meyer Curve Works
In the classic Lothar Meyer graph, the x-axis shows atomic number (proton count, moving left to right), and the y-axis displays atomic volume (volume occupied by one mole of the element’s atoms). Each point represents an element. Peaks, troughs, and repeating shapes mark periods.
- Maxima: Alkali metals (Li, Na, K, Rb, Cs) have the largest atomic volumes—these form the peaks.
- Descending curve: Alkaline earth metals (Be, Mg, Ca, Sr, Ba) sit just after the maxima.
- Minima: Transition elements and some post-transition elements create the lowest points.
- Ascending curve: Halogens and noble gases (Cl, Ar, etc.) rise towards the next maximum.
This graphical pattern reflects why elements with similar valence and properties appear at regular intervals—key for understanding trends examined in JEE Main Chemistry.
Lothar Meyer’s Law
Lothar Meyer’s periodic law states: “The physical properties of elements are periodic functions of their atomic weights.” In modern terms, this means that when elements are arranged in order of increasing atomic mass (today, atomic number), their properties repeat periodically.
- Atomic volume is not random; it follows a periodic trend.
- Elements with similar chemical and physical properties lie at similar locations on the curve.
- This statement aided the development of the modern periodic law (properties are periodic functions of atomic number).
Significance and JEE Applications
The Lothar Meyer Curve provides a visual and logical method to predict similarities and differences in atomic properties across the periodic table—vital for JEE problem solving. It helps explain the recurrence of element properties and offers a bridge from Mendeleev’s law to the modern periodic concept based on atomic number.
| Feature | Lothar Meyer | Mendeleev |
|---|---|---|
| Basis for classification | Physical properties (atomic volume) | Chemical properties (reactivity, valency) |
| Law statement | Properties are periodic functions of atomic mass | Properties are periodic functions of atomic mass |
| Prediction of new elements | No clear predictions | Predicted several elements like gallium, germanium |
| Graphical representation | Yes | No |
| JEE relevance | MCQs on periodic trends, graphical analysis | MCQs on predictions, table arrangement |
For more on the evolution of classification, see historical development of the periodic table and periodicity practice.
Limitations of the Lothar Meyer Curve
- The law was based on atomic mass, not atomic number (missing some periodicity).
- Graph does not account for all physical or chemical properties (mainly atomic volume).
- No predictions for undiscovered elements or their properties (unlike Mendeleev).
- Some elements’ positions on the curve are ambiguous due to atomic volume irregularities.
- In modern practice, atomic number explains periodicity more accurately.
JEE-style Example and Practice Question
Example: Identify where alkali metals and transition metals would be found in the Lothar Meyer Curve and explain the trend.
- Alkali metals (Li, Na, K, etc.) are at the maxima (peaks)—they have the largest atomic volumes in each period.
- Transition metals (Fe, Cu, Ni, etc.) appear at the minima (troughs)—showing smaller atomic volumes.
- This periodic rise and fall reiterates similar properties at these locations every period.
Sample MCQ: In the Lothar Meyer graph, which set of elements corresponds to the maxima?
- A) Halogens
- B) Alkaline earth metals
- C) Transition elements
- D) Alkali metals (correct)
For additional problem-solving, review periodicity practice paper and atomic structure questions.
Quick Revision: Lothar Meyer Curve Cheatsheet
- Plots atomic volume (y-axis) versus atomic number (x-axis).
- Alkali metals: maxima; transition metals: minima.
- Proved physical properties repeat periodically.
- Basis for graphical analysis in early periodic law.
- Contrast: Mendeleev focused on prediction and chemical properties.
Mastering the Lothar Meyer Curve strengthens your understanding of periodic trends and helps you interpret graphical patterns, a skill often tested in JEE Main Chemistry.
Explore more JEE Chemistry topics like modern periodic table, atomic structure, and properties of elements for comprehensive preparation. Vedantu curates these materials with top educators for exam success.


FAQs on Understanding the Lothar Meyer Curve: Periodic Law and Graphical Trends
1. What is the law of Lothar Meyer?
Lothar Meyer's law states that the atomic volume of elements, when plotted against their atomic numbers, shows a periodic rise and fall, demonstrating repeating patterns among elements.
Key points about the law:
- The graph is known as the Lothar Meyer curve.
- Elements with similar properties occur at similar points on successive cycles of the curve.
- This was a major contribution to understanding periodicity in chemistry.
2. What does Lothar Meyer's curve represent in chemistry?
The Lothar Meyer curve represents the relationship between atomic volume and atomic number, highlighting periodic trends among elements.
It shows that:
- Similar elements occur at the crests or troughs of the curve.
- Periodic properties like reactivity and metallic character repeat at regular intervals.
- It was an early graphical proof of the periodic law in chemistry.
3. What are the main limitations of Lothar Meyer's graph?
Lothar Meyer's graph had several limitations that affected its adoption compared to other approaches:
- It was based only on atomic volume, ignoring other chemical properties.
- Transition elements did not fit smoothly into the trend.
- It could not predict properties or places for undiscovered elements.
- Modern atomic structure concepts were not yet known at the time.
4. How did Lothar Meyer contribute to the development of the periodic table?
Lothar Meyer contributed by graphically demonstrating that elements with similar properties repeat at regular atomic number intervals.
His work led to:
- Revealing periodic trends visually for the first time.
- Laying the groundwork for later classification of elements.
- Influencing the adoption of the periodic law.
5. Who was Lothar Meyer, and how does his contribution differ from Mendeleev's?
Lothar Meyer and Dmitri Mendeleev were both pioneers in organizing the chemical elements.
Main differences:
- Meyer used atomic volume vs. atomic number curves to show periodic trends.
- Mendeleev created a comprehensive periodic table arranged by atomic mass and left spaces for undiscovered elements.
- Mendeleev's system was more predictive and widely adopted, while Meyer's had key graphical insights.
6. What is the graphical interpretation of the Lothar Meyer curve?
The Lothar Meyer curve is a graph where the y-axis represents atomic volume and the x-axis represents atomic number.
The curve shows:
- Sharp peaks for alkali metals (largest atomic volumes).
- Valleys for transition metals (smallest atomic volumes).
- A repeating, wavelike pattern indicating periodicity of element properties.
7. Can the Lothar Meyer curve predict properties of unknown elements?
The Lothar Meyer curve could show periodic trends, but it was not effective in predicting properties or existence of undiscovered elements.
Limitations included:
- Lack of gaps or placeholders for new elements.
- Focus on atomic volume alone, not chemical behaviour.
- Mendeleev's table was better suited for predictions.
8. Is the Lothar Meyer curve still relevant in modern chemistry?
The Lothar Meyer curve remains historically significant and is useful for understanding periodic trends, especially for exam preparation (JEE, NEET, CBSE).
However:
- Modern periodic tables use atomic numbers, not atomic volumes, for classification.
- The curve illustrates early evidence for periodicity and validates the periodic law.
9. Why is the Lothar Meyer curve important for students preparing for JEE or NEET?
The Lothar Meyer curve is important for JEE/NEET because questions test understanding of periodic trends, graphical interpretation, and law distinctions.
It helps students:
- Visualize periodicity in element properties.
- Answer multiple-choice or assertion-reason questions.
- Discriminate between Meyer and Mendeleev approaches.
10. What is the difference between Lothar Meyer’s law and Mendeleev’s periodic law?
Lothar Meyer’s law is based on atomic volume and graphical trends, while Mendeleev’s periodic law is based on atomic mass and chemical properties.
Key points:
- Meyer: Used plots of atomic volume vs. atomic number; focus on trends.
- Mendeleev: Created a table, predicted new elements; sorted by atomic mass.
- Mendeleev’s approach was predictive and widely adopted.