


How to Analyze and Compare Motion Graphs for Physics Students
Displacement, velocity, and acceleration time graphs are fundamental for the analysis of motion in physics. These graphs provide a visual representation of how displacement, velocity, and acceleration vary with respect to time, enabling the determination of key motion parameters and supporting quantitative analysis essential for JEE Main preparation.
Definition of Motion Parameters
Displacement is the shortest path connecting an object’s initial and final positions. It is a vector quantity and can be positive, negative, or zero. Velocity is defined as the rate of change of displacement with respect to time, while acceleration is the rate of change of velocity with time, both being vector quantities.
Displacement-Time Graphs
A displacement-time graph illustrates how an object's displacement changes with time. In such a graph, time is represented on the horizontal axis and displacement on the vertical axis. The nature of the graph depends on the type of motion.
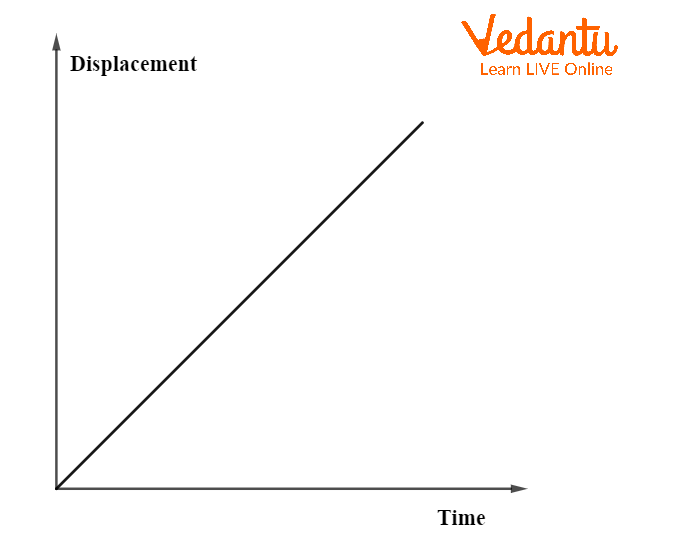
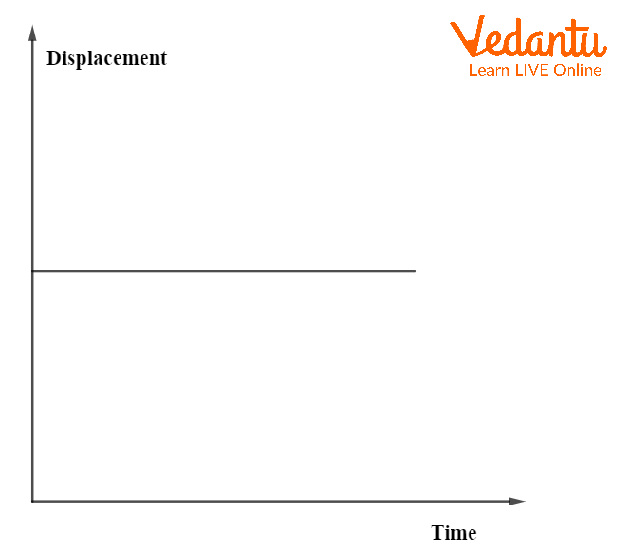
For uniform motion, the displacement-time graph is a straight line with constant slope, indicating constant velocity. If the object is at rest, the graph is a horizontal line parallel to the time axis, showing zero velocity.
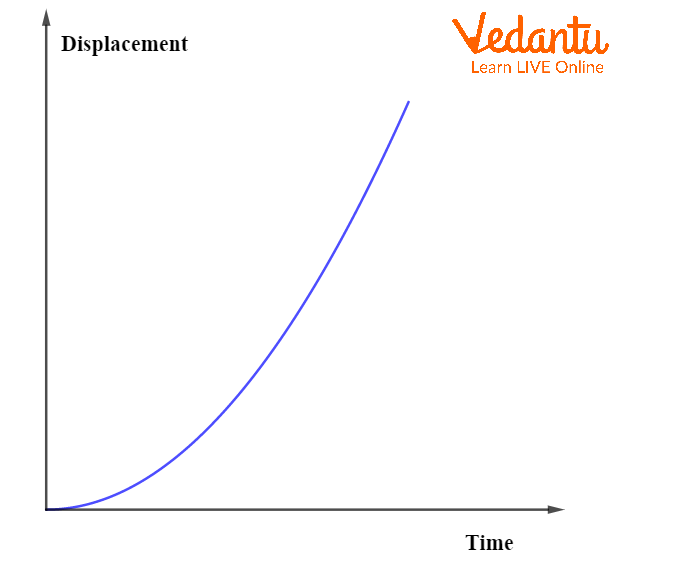
In the case of uniformly accelerated motion, the displacement-time graph forms a parabola, as displacement increases non-linearly due to changing velocity.
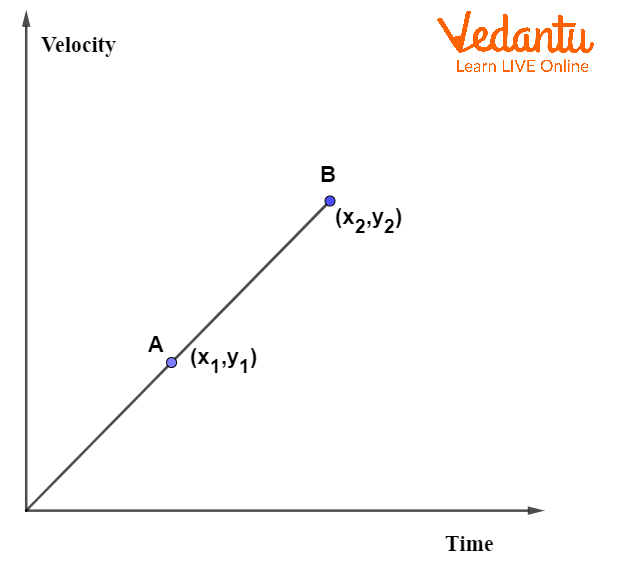
The slope of the displacement-time graph at any point gives the instantaneous velocity of the object. For a straight line, the velocity is constant and calculated as the ratio of change in displacement to change in time.
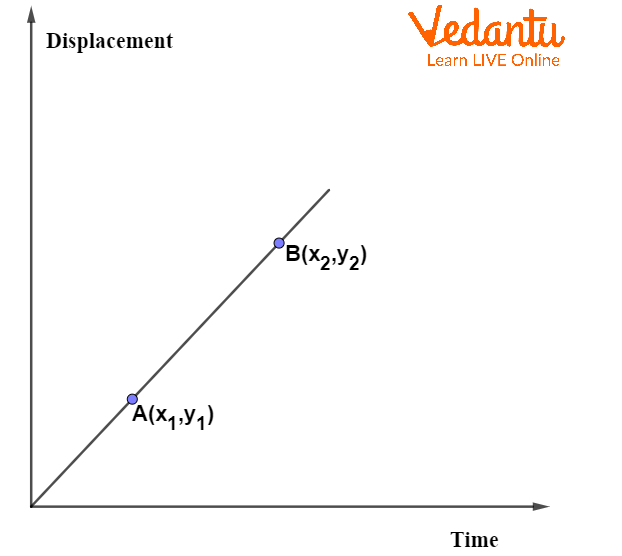
The velocity from two points, $\left( x_1, y_1 \right)$ and $\left( x_2, y_2 \right)$, on the displacement-time graph is given by $v = \dfrac{y_2 - y_1}{x_2 - x_1}$.
Further clarifications on the properties and applications of displacement-time graphs can be found in the Displacement And Velocity Time Graphs resource.
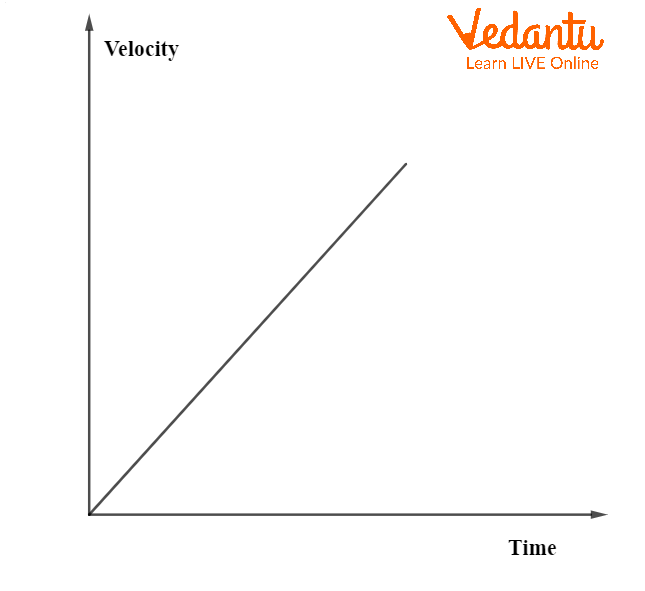
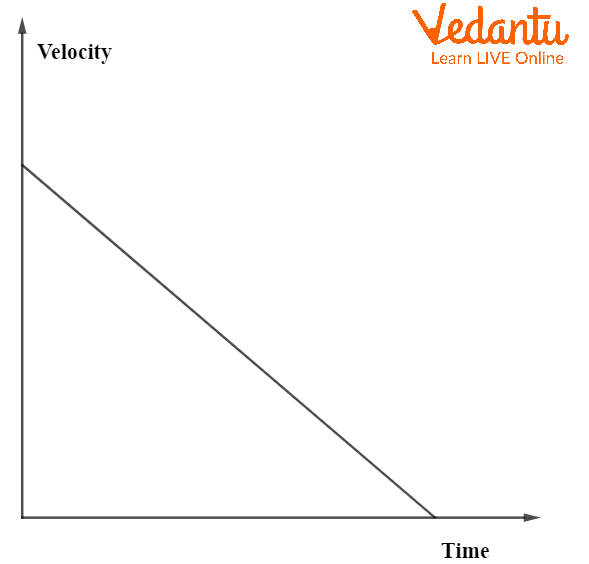
Velocity-Time Graphs
A velocity-time graph presents how the velocity of an object varies with time. Time is plotted on the x-axis, and velocity on the y-axis. The nature of the slope and the area under the curve provide significant information.
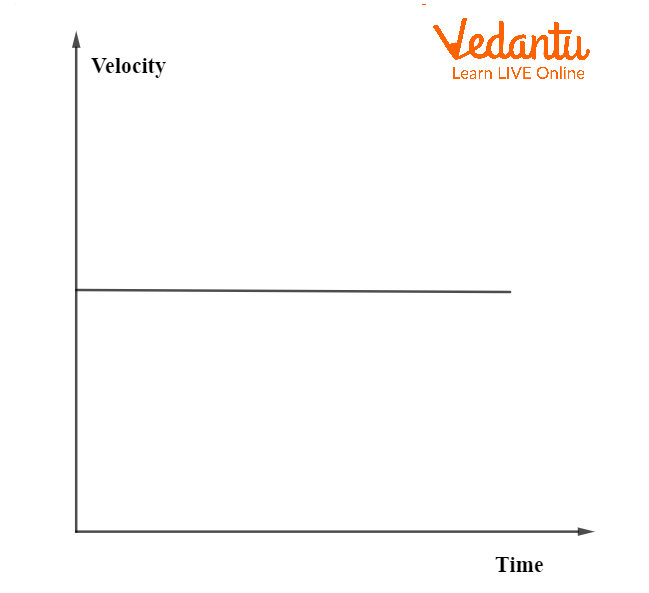
For constant velocity, the graph is a horizontal straight line, showing zero acceleration. Uniform acceleration produces a straight line with a positive slope, while uniform retardation (negative acceleration) yields a straight line with a negative slope.
In non-uniform acceleration, the velocity-time graph does not have a constant slope. Instead, the changes occur irregularly, reflecting varying acceleration.
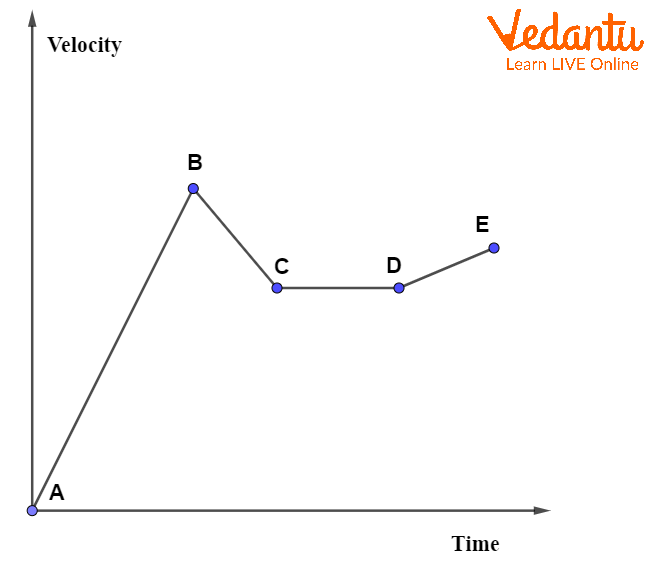
The acceleration is determined from the slope of the velocity-time graph at any point. A positive slope indicates increasing velocity (acceleration), and a negative slope indicates decreasing velocity (retardation).
For two points $\left( x_1, y_1 \right)$ and $\left( x_2, y_2 \right)$ on a velocity-time graph, acceleration is $a = \dfrac{y_2 - y_1}{x_2 - x_1}$.
The area under the velocity-time curve between two instants gives the displacement during that interval. For uniform velocity, displacement is the product of velocity and time interval. For varying velocity, displacement is obtained as the area under the curve.
Acceleration-Time Graphs
An acceleration-time graph describes the change in acceleration with respect to time. In this graph, acceleration is represented on the vertical axis and time on the horizontal axis. If acceleration is constant, the graph is a straight horizontal line.
The area under the acceleration-time graph between two time intervals gives the change in velocity during that period. For variable acceleration, the area under the curve is used to determine the net change in velocity.
The methodologies of using acceleration in kinematics can be explored in the Acceleration Formula resource.
Displacement-Acceleration Graphs
The displacement-acceleration graph depicts how acceleration varies with displacement. This form is useful in the study of oscillatory motions such as simple harmonic motion (SHM), where acceleration is a function of displacement.
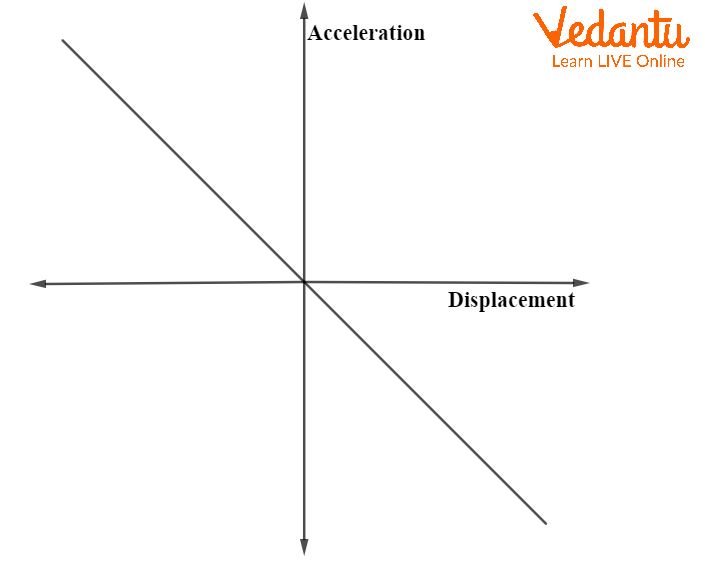
In SHM, the acceleration is given by $a = -\omega^2 x$, resulting in a straight line passing through the origin with a negative slope in the acceleration-displacement graph.
Comparison of Displacement, Velocity, and Acceleration Time Graphs
| Graph | Key Features |
|---|---|
| Displacement-Time | Slope gives velocity |
| Velocity-Time | Slope gives acceleration, area gives displacement |
| Acceleration-Time | Area gives change in velocity |
For in-depth knowledge regarding motion in one dimension and related graphs, see the Motion In One Dimension resource.
Solved Example: Calculation from Time Graphs
An object moves with constant velocity of $5\,\text{m/s}$ for $8$ seconds. Calculate the displacement using the velocity-time graph method.
- Velocity $v = 5\,\text{m/s}$
- Time interval $t = 8\,\text{s}$
- Displacement $= v \times t = 5 \times 8 = 40\,\text{m}$
This method relies on interpreting the area under the constant velocity line on the graph.
Important Points on Time Graph Interpretation
- Constant slope in displacement-time graph means constant velocity
- Zero slope in velocity-time graph indicates zero acceleration
- Area under velocity-time graph equals displacement
- Area under acceleration-time graph provides change in velocity
- Parabolic displacement-time indicates uniform acceleration
- Negative velocity in velocity-time graph shows reversal of direction
Deeper concepts on kinematics and graphical analysis can be studied in Kinematics.
Summary of Displacement, Velocity, and Acceleration Time Graphs
Displacement-time, velocity-time, and acceleration-time graphs are indispensable for analyzing different aspects of motion. Mastering the interpretation of slopes and areas under these curves allows precise calculation of velocity, acceleration, and displacement essential for problem-solving in JEE Main.
FAQs on Understanding Displacement, Velocity, and Acceleration Time Graphs
1. What is the difference between displacement, velocity, and acceleration time graphs?
Displacement-time, velocity-time, and acceleration-time graphs each display how different motion parameters change with time:
- Displacement-time graph: Shows an object's position versus time. The slope at any point gives the velocity.
- Velocity-time graph: Displays how velocity changes over time. The slope represents acceleration, and the area under the curve gives displacement.
- Acceleration-time graph: Illustrates acceleration as it changes with time. The area under the curve gives change in velocity.
2. How do you interpret a displacement-time graph?
A displacement-time graph shows how an object's position or displacement varies over time.
- A straight, sloped line means constant velocity.
- A horizontal line represents zero velocity (object is stationary).
- A curved line indicates changing velocity (acceleration).
3. What does the slope of a velocity-time graph represent?
The slope of a velocity-time graph gives the acceleration of an object.
- A constant slope means constant acceleration.
- A horizontal line shows zero acceleration (constant velocity).
- A positive slope indicates increasing velocity; a negative slope, decreasing velocity.
4. How do you find displacement from a velocity-time graph?
Displacement from a velocity-time graph is equal to the area under the curve between two time intervals.
- For straight-line segments, use the area of rectangles and triangles.
- Subtract areas below the time-axis (negative velocity).
5. What does a horizontal line on an acceleration-time graph indicate?
A horizontal line on an acceleration-time graph means the object is experiencing constant acceleration.
- If the line is at zero, acceleration is zero (velocity is constant).
- If the line is above zero, positive constant acceleration.
- If below zero, negative constant acceleration (deceleration).
6. Why are graphs important in understanding motion?
Graphs are essential in learning motion since they visually represent relationships between physical quantities and time.
- They simplify complex motion into clear patterns.
- Allow quick extraction of useful information like velocity and acceleration.
- Help in predicting future motion and solving numerical problems.
7. How does the shape of a displacement-time graph indicate acceleration?
A curved displacement-time graph shows that the object's velocity is changing, which means there is acceleration.
- If the curve bends upwards, acceleration is positive.
- If it bends downwards, acceleration is negative (deceleration).
8. What is the significance of the area under an acceleration-time graph?
The area under an acceleration-time graph gives the change in velocity of an object over the specified time.
- Area above the time axis represents positive change in velocity.
- Area below the axis indicates negative change (slowing down).
9. How can you differentiate between uniform and non-uniform motion using graphs?
Uniform motion has constant velocity, shown by straight lines on displacement-time and velocity-time graphs.
- Uniform motion: Straight line in displacement-time; horizontal line in velocity-time.
- Non-uniform motion: Curved displacement-time graph; sloping or irregular velocity-time graph.
10. What information can you get from the slope of a displacement-time graph?
The slope of a displacement-time graph at any point gives the instantaneous velocity of the object.
- Positive slope: moving forward.
- Negative slope: moving backward.
- Zero slope: stationary object.
11. What is the use of velocity-time graphs in solving equations of motion?
Velocity-time graphs simplify the application of equations of motion by visually showing:
- Accelerated vs. uniform motion.
- Area under the curve (displacement).
- Time intervals for different speeds.