


Understand Data Handling with Class 4 Maths Chapter 14 Important Questions
Explore these 14 solved questions to practise organising data, reading tables and interpreting pictographs. Solve the MCQs and written questions below, check the step-by-step answers and download the Class 4 Maths Chapter 14 Important Questions PDF to continue practising at home.
Class 4 Maths Chapter 14 Important Questions MCQ (Multiple Choice Questions)
1. A teacher asks students about their favourite fruits. Which question will help her collect the most suitable data?
(a) Do you eat fruits every day?
(b) Which fruit do you like the most?
(c) How many fruits are in the market?
(d) What colour is your school bag?
Answer: (b) Which fruit do you like the most?
Explanation:
The teacher wants to find the most liked fruit. Asking each student to name their favourite fruit helps her collect suitable information.
2. A class survey shows the following favourite games. Which game is liked by the most students?
(a) Chess
(b) Football
(c) Cricket
(d) Badminton
Answer: (c) Cricket
Explanation:
Cricket is liked by 15 students, which is the highest number in the table.
3. Which method makes it easier to compare the number of students choosing different activities?
(a) Writing all names together without grouping
(b) Recording the number of students for each activity in a table
(c) Writing only the names of the activities
(d) Leaving the responses uncounted
Answer: (b) Recording the number of students for each activity in a table.
4. A pictograph uses one picture of a flower to represent 2 flowers. What do 6 flower pictures represent?
(a) 6 flowers
(b) 8 flowers
(c) 10 flowers
(d) 12 flowers
Answer: (d) 12 flowers
Solution:
1 picture = 2 flowers
6 pictures = 6 × 2 = 12 flowers
Class 4 Maths Chapter 14 Data Handling – Very Short Answer Questions
5. What is data handling?
Answer:
Data handling means collecting, arranging and understanding information so that we can compare quantities and answer questions.
6. A survey records the favourite colours of 24 children. If 9 choose blue, 6 choose red and 5 choose green, how many choose yellow?
Answer:
Children choosing blue, red and green = 9 + 6 + 5 = 20
Children choosing yellow = 24 − 20 = 4 children
7. What is a pictograph, and why is it useful?
Answer:
A pictograph uses pictures or symbols to show numbers. It makes information easy to read, count and compare.
Class 4 Maths Chapter 14 Important Questions – Short Answer Questions
8. Look at the pictograph showing the number of books read by four students. Answer the questions.
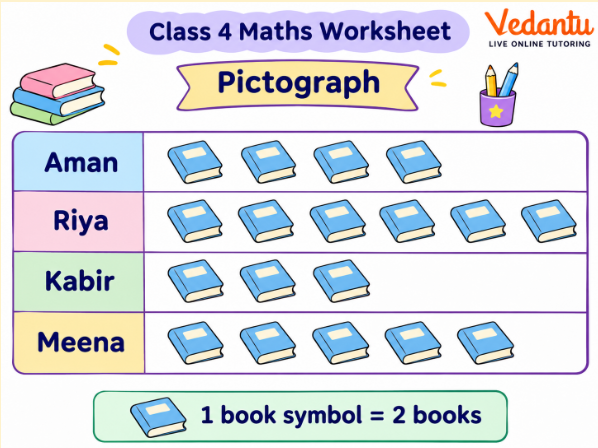
Questions:
(a) How many books did Aman read?
(b) Who read the most books?
(c) How many books did Kabir and Meena read altogether?
(d) How many more books did Riya read than Kabir?
Answer:
Each symbol represents 2 books.
(a) Aman: 4 × 2 = 8 books
(b) Riya: 6 × 2 = 12 books, the highest number.
(c) Kabir: 3 × 2 = 6 books
Meena: 5 × 2 = 10 books
Total = 6 + 10 = 16 books
(d) Riya read 12 books and Kabir read 6 books.
Difference = 12 − 6 = 6 books
9. A teacher records how many children prefer different school subjects. Complete the table and answer the questions.
The responses are:
Maths – 12, Languages – 9, Arts – 7, Physical Education – 11, The World Around Us – 6.
Questions:
(a) How many children participated in the survey?
(b) Which subject is the least popular?
(c) How many more children chose Maths than Arts?
Answer:
(a) Total children = 12 + 9 + 7 + 11 + 6 = 45
(b) The World Around Us is the least popular, with 6 children.
(c) Difference = 12 − 7 = 5 children
10. A school canteen records the number of juice glasses sold during four days. Find the total and identify the day with the highest sales.
Answer:
Total glasses sold = 18 + 25 + 21 + 16
= 80 glasses
Tuesday had the highest sales, with 25 glasses.
The difference between the highest and lowest sales:
25 − 16 = 9 glasses
11. Look at the pictograph showing the number of colourful golas sold at a school fair.
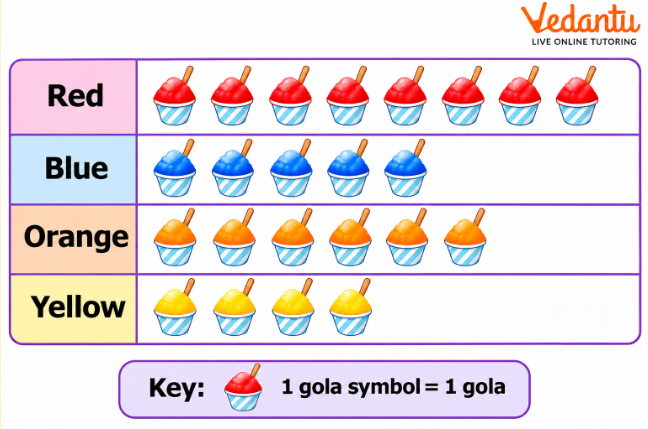
Questions:
(a) Which colour gola was sold the most?
(b) Which colour gola was sold the least?
(c) How many golas were sold altogether?
(d) How many more red golas were sold than yellow golas?
Answer:
(a) Red golas were sold the most: 8.
(b) Yellow golas were sold the least: 4.
(c) Total = 8 + 5 + 6 + 4 = 23 golas
(d) Difference = 8 − 4 = 4 golas
Class 4 Maths Chapter 14 Data Handling – Long Answer Questions
12. A teacher collects information about the games played by 40 students. Some students play only chess, some play only cricket, some play both games and others play neither. Study the table and answer the questions.
Questions:
(a) How many students play only chess?
(b) How many students play both games?
(c) How many students play cricket, including those who play both games?
(d) How many students do not play either game?
(e) How many boys and girls participated in the survey?
Answer:
(a) Students playing only chess:
6 + 4 = 10 students
(b) Students playing both games:
4 + 6 = 10 students
(c) Students playing cricket:
Only cricket = 5 + 9 = 14
Both games = 10
Total = 14 + 10 = 24 students
(d) Students playing neither game:
3 + 3 = 6 students
(e) Total girls:
6 + 5 + 4 + 3 = 18 girls
Total boys:
4 + 9 + 6 + 3 = 22 boys
Total students = 18 + 22 = 40 students
13. A school organises a Bal Mela for three days. Two stalls sell fruit chaats and sandwiches. Study the pictograph and calculate the sales.
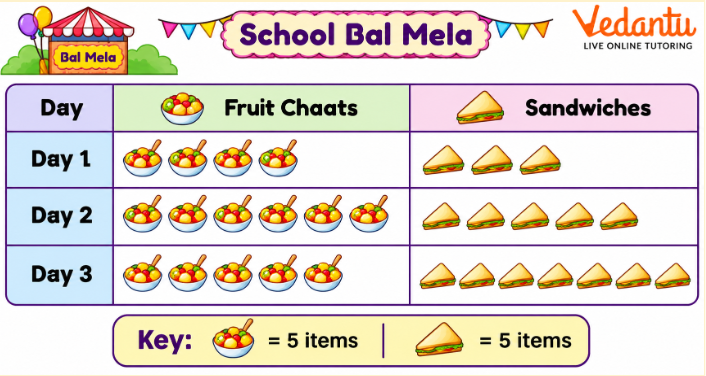
Questions:
(a) How many fruit chaats were sold on Day 2?
(b) How many sandwiches were sold on Day 3?
(c) Find the total number of fruit chaats sold over three days.
(d) Find the total number of sandwiches sold over three days.
(e) Which day had the highest combined sales?
Answer:
Each symbol represents 5 items.
(a) Fruit chaats sold on Day 2:
6 × 5 = 30 fruit chaats
(b) Sandwiches sold on Day 3:
7 × 5 = 35 sandwiches
(c) Total fruit chaats:
Day 1 = 4 × 5 = 20
Day 2 = 6 × 5 = 30
Day 3 = 5 × 5 = 25
Total = 20 + 30 + 25 = 75 fruit chaats
(d) Total sandwiches:
Day 1 = 3 × 5 = 15
Day 2 = 5 × 5 = 25
Day 3 = 7 × 5 = 35
Total = 15 + 25 + 35 = 75 sandwiches
(e) Combined sales:
Day 3 had the highest combined sales, with 60 items sold.
14. A class wants to choose one activity for its annual school celebration. The teacher surveys 50 students and records their choices. Study the information and answer the questions.
Questions:
(a) Which activity received the highest number of votes?
(b) Which activity received the lowest number of votes?
(c) How many more students chose dancing than storytelling?
(d) How many students chose drawing and singing altogether?
(e) If 5 students change their choice from dancing to storytelling, what will be the new number of votes for each activity?
(f) Which activity should be selected if the class follows the original survey results?
Answer:
(a) Dancing received the highest number of votes: 16.
(b) Storytelling received the lowest number of votes: 9.
(c) Difference:
16 − 9 = 7 students
(d) Drawing and singing:
14 + 11 = 25 students
(e) After 5 students change their choices:
Dancing = 16 − 5 = 11
Storytelling = 9 + 5 = 14
The total number of students remains 50 because the students only changed their choices.
(f) Based on the original survey, dancing should be selected because it received the highest number of votes.
Why Practise Class 4 Maths Chapter 14 Data Handling with Vedantu?
Data Handling teaches students how to turn everyday information into meaningful answers. Whether children are comparing their classmates' favourite subjects or counting items sold at a school fair, Vedantu's chapter-based questions help them understand data using familiar situations.
The Class 4 Maths Chapter 14 important questions PDF download helps students practise these skills:
Collect useful information: Understand how to ask suitable survey questions and record responses.
Organise data correctly: Arrange information in tables to make counting and comparison easier.
Read pictographs: Use symbols and their values to calculate quantities.
Compare information: Identify the highest, lowest and equal quantities from a given data set.
Solve everyday problems: Calculate totals and differences using information from classroom activities and school events.
Students can use Vedantu's Class 4 Maths Chapter 14 important questions PDF with the same 14 solved questions shown above to practise independently and check their calculations.
Class 4 Maths Chapter 14 Math-Mela Study Materials
Explore the following materials to understand Data Handling.
CBSE Class 4 Maths Chapter-wise Important Questions
Practise important questions from the other chapters of the Math-Mela textbook.
Other Important Study Materials for CBSE Class 4 Maths
FAQs on Important Questions for Class 4 Maths (Math-Mela) Chapter 14 Data Handling | 2026-27
1. What are the important questions for Class 4 Maths Chapter 14 Data Handling?
Class 4 Maths Chapter 14 important questions and answers cover collecting data through surveys, organising responses in tables, reading pictographs and comparing quantities. Students should also practise finding totals, differences and the most or least common choices.
2. What is a pictograph in Class 4 Maths Chapter 14?
A pictograph represents information using pictures or symbols. Each symbol may represent one or more items. For example, if one sandwich symbol represents 5 sandwiches, four symbols represent 20 sandwiches. Students must read the key before calculating.
3. How can students identify the most and least popular choices from a data table?
Students should compare the numbers recorded against each choice. The choice with the highest number is the most popular, while the one with the lowest number is the least popular. A well-organised table makes these comparisons easier.
4. What types of MCQs are important for Class 4 Maths Chapter 14?
Class 4 Maths Chapter 14 important questions MCQ practice includes selecting suitable survey questions, reading data tables, identifying the highest or lowest quantity and calculating values from pictographs. Students should understand the information before choosing an answer.
5. How do you calculate the total number of items from a pictograph?
First, count the symbols in each row and check what one symbol represents. Multiply the number of symbols by their value, then add the results if a total is required. For example, 6 symbols representing 5 items each give 6 × 5 = 30 items.
6. How can I download the Class 4 Maths Chapter 14 Data Handling questions and answers PDF?
Students can use Vedantu's PDF download section to access the solved practice questions. The PDF contains the same 14 questions and answers, including MCQs, survey tables and pictograph-based problems, for practice at home.
7. What is the difference between collecting data and organising data?
Collecting data means gathering information, such as asking classmates about their favourite games. Organising data means arranging the collected responses into categories or tables. Organised data helps students understand and compare information more easily.