


The following table shows the number of illiterate persons in the age group (10-58 years) in a town. Represent the given data by means of a histogram.

Answer
598.2k+ views
Hint: Assume 1 small division = 20 illiterate persons. Now, using this, get the number of divisions for all the age group intervals. Then, plot the histogram. There is no need to convert the table in exclusive form.
Complete step by step solution:
According to the question we have a table which is showing the number of illiterate persons according to the age group in a town. We have to represent those data by means of histogram.
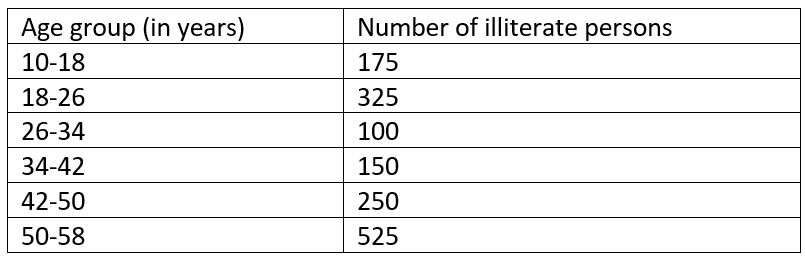
We know that histogram is the approximate representation of the distribution of numerical data.
The given table is in exclusive form. So, we can directly plot the histogram.
Let us assume that 1 small division represents 20 illiterate persons.
1 small division = 20 illiterate persons ……………………………………..(1)
From the table, we have 175 illiterate persons for the age group 10-18.
Since, 1 small division is equal to 20 illiterate persons so, for 175 illiterate persons,
175 illiterate persons = \[\dfrac{175}{20}=8.75\] small divisions ………………………….(2)
From the table, we have 325 illiterate persons for the age group 18-26.
Since, 1 small division is equal to 20 illiterate persons so, for 175 illiterate persons,
325 illiterate persons = \[\dfrac{325}{20}=16.25\] small divisions ………………………….(3)
From the table, we have 100 illiterate persons for the age group 26-34.
Since, 1 small division is equal to 20 illiterate persons so, for 100 illiterate persons,
100 illiterate persons = \[\dfrac{100}{20}=5\] small divisions ………………………….(4)
From the table, we have 150 illiterate persons for the age group 34-42.
Since, 1 small division is equal to 20 illiterate persons so, for 150 illiterate persons,
150 illiterate persons = \[\dfrac{150}{20}=7.5\] small divisions ………………………….(5)
From the table, we have 100 illiterate persons for the age group 26-34.
Since, 1 small division is equal to 20 illiterate persons so, for 100 illiterate persons,
100 illiterate persons = \[\dfrac{100}{20}=5\] small divisions ………………………….(6)
From the table, we have 525 illiterate persons for the age group 50-58.
Since, 1 small division is equal to 20 illiterate persons so, for 525 illiterate persons,
525 illiterate persons = \[\dfrac{525}{20}=26.25\] small divisions ………………………….(7)
Now, using equation (2), equation (3), equation (4), equation (5), equation (6), and equation (7), plotting the histogram,
A break is indicated near the origin on the x-axis because the scale starts at 10.
The above one is the required histogram.
Note: In this question, one might try to convert the given table in exclusive form by deducting 0.5 in the lower limit of the age group interval and by adding 0.5 in the upper limit of the age group interval. This is wrong because the table is already exclusive. So, there is no need to convert it into exclusive form.
Complete step by step solution:
According to the question we have a table which is showing the number of illiterate persons according to the age group in a town. We have to represent those data by means of histogram.
We know that histogram is the approximate representation of the distribution of numerical data.
The given table is in exclusive form. So, we can directly plot the histogram.
Let us assume that 1 small division represents 20 illiterate persons.
1 small division = 20 illiterate persons ……………………………………..(1)
From the table, we have 175 illiterate persons for the age group 10-18.
Since, 1 small division is equal to 20 illiterate persons so, for 175 illiterate persons,
175 illiterate persons = \[\dfrac{175}{20}=8.75\] small divisions ………………………….(2)
From the table, we have 325 illiterate persons for the age group 18-26.
Since, 1 small division is equal to 20 illiterate persons so, for 175 illiterate persons,
325 illiterate persons = \[\dfrac{325}{20}=16.25\] small divisions ………………………….(3)
From the table, we have 100 illiterate persons for the age group 26-34.
Since, 1 small division is equal to 20 illiterate persons so, for 100 illiterate persons,
100 illiterate persons = \[\dfrac{100}{20}=5\] small divisions ………………………….(4)
From the table, we have 150 illiterate persons for the age group 34-42.
Since, 1 small division is equal to 20 illiterate persons so, for 150 illiterate persons,
150 illiterate persons = \[\dfrac{150}{20}=7.5\] small divisions ………………………….(5)
From the table, we have 100 illiterate persons for the age group 26-34.
Since, 1 small division is equal to 20 illiterate persons so, for 100 illiterate persons,
100 illiterate persons = \[\dfrac{100}{20}=5\] small divisions ………………………….(6)
From the table, we have 525 illiterate persons for the age group 50-58.
Since, 1 small division is equal to 20 illiterate persons so, for 525 illiterate persons,
525 illiterate persons = \[\dfrac{525}{20}=26.25\] small divisions ………………………….(7)
Now, using equation (2), equation (3), equation (4), equation (5), equation (6), and equation (7), plotting the histogram,
A break is indicated near the origin on the x-axis because the scale starts at 10.
The above one is the required histogram.
Note: In this question, one might try to convert the given table in exclusive form by deducting 0.5 in the lower limit of the age group interval and by adding 0.5 in the upper limit of the age group interval. This is wrong because the table is already exclusive. So, there is no need to convert it into exclusive form.
Recently Updated Pages
Master Class 8 Social Science: Engaging Questions & Answers for Success
Master Class 8 English: Engaging Questions & Answers for Success
Class 8 Question and Answer - Your Ultimate Solutions Guide
Master Class 8 Maths: Engaging Questions & Answers for Success
Master Class 8 Science: Engaging Questions & Answers for Success
Master Class 9 General Knowledge: Engaging Questions & Answers for Success
Trending doubts
What is BLO What is the full form of BLO class 8 social science CBSE
Citizens of India can vote at the age of A 18 years class 8 social science CBSE
Full form of STD, ISD and PCO
Advantages and disadvantages of science
Right to vote is a AFundamental Right BFundamental class 8 social science CBSE
What are the 12 elements of nature class 8 chemistry CBSE