


How to Write Full Marks Answers in NCERT Class 5 Maths Chapter 15?
NCERT Textbook Pages 179-180
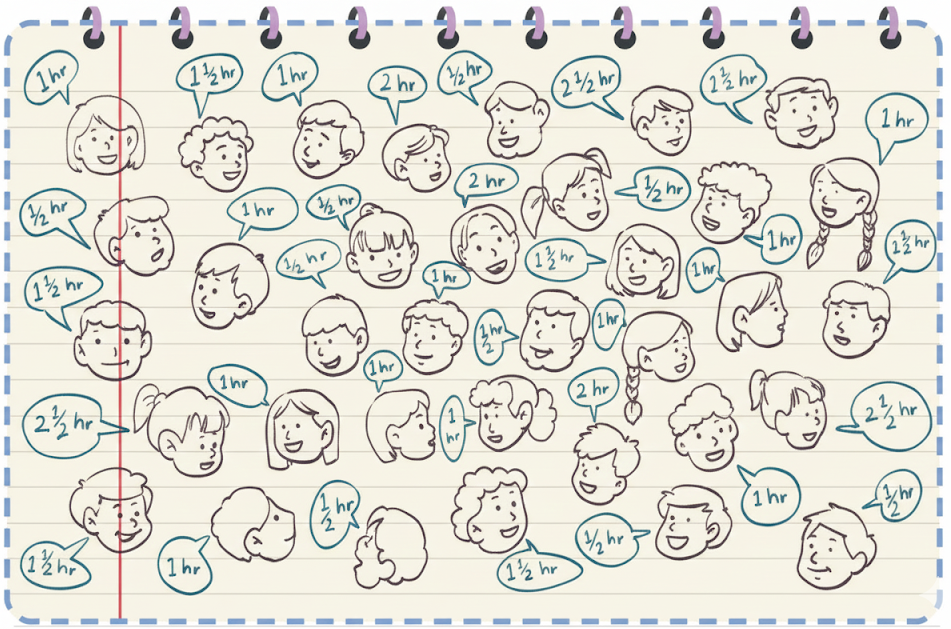
Child TV Reporter
Samaira and Kabir decided to act like reporters and collect information from their friends.
They collected data from 35 friends and recorded it in a notebook as shown below.
Solution:
Look at the table and answer the following questions.
Question 1. How many children watch TV for more than half an hour?
Solution: The total number of children who watch TV for more than half an hour is:
13 + 7 + 3 + 3 = 26 children.
Question 2. How many children watch TV for less than two hours?
Solution: The number of children who watch TV for less than two hours is:
9 + 13 + 7 = 29 children.
Question 3. The number of children who watch TV for more than two hours is _________.
Solution: There are 3 children who watch TV for more than two hours.
Question 4. More children watch TV for two hours than half an hour. (True/False)
Solution: The given statement is incorrect, because only 3 children watch TV for two hours, whereas 9 children watch TV for half an hour.
5. Can watching TV for a long time be harmful to the eyes?
Solution: Yes, watching television for long periods can lead to eye strain and fatigue.
NCERT Textbook Pages 180-181
Stock-Taking in a Shop
Joseph Uncle takes stock of the play items (toys, board games, and sports items) in his store a week before the summer break. He tries to record the items in his shop using a pictograph. He notices that there are too many items of each kind in his shop and it is not easy to make a picture for every item
Dipesh, one of his helpers, suggested using one picture (icon) for every 5 items of each kind.
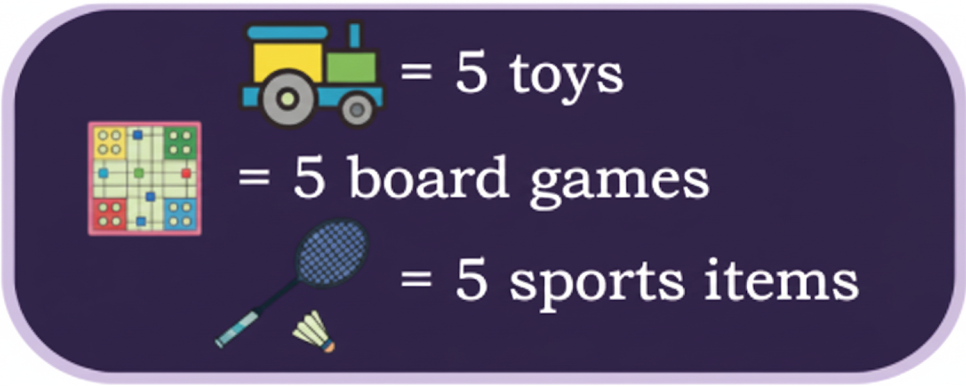
Dipesh used a scale while recording the items in the pictograph. A scale helps record a large number of things using fewer icons.
Now, answer the following questions based on the above pictograph.
Question 1. How many toys does Joseph Uncle have?
Solution: Uncle Joseph has 40 toys (8 × 5 = 40).
Question 2. How many board games does Joseph Uncle have?
Solution: Uncle Joseph has 50 board games (10 × 5 = 50).
Question 3. How many total play items does Joseph Uncle have?
Solution:
Uncle Joseph has 60 sports items (12 × 5 = 60).
So, the total number of play items he has is 40 + 50 + 60 = 150.
Question 4. Is there any other scale that you can use to make the pictograph?
Solution: Yes, we can use a different scale to make the pictograph easier to understand.
NCERT Textbook Pages 181 -182
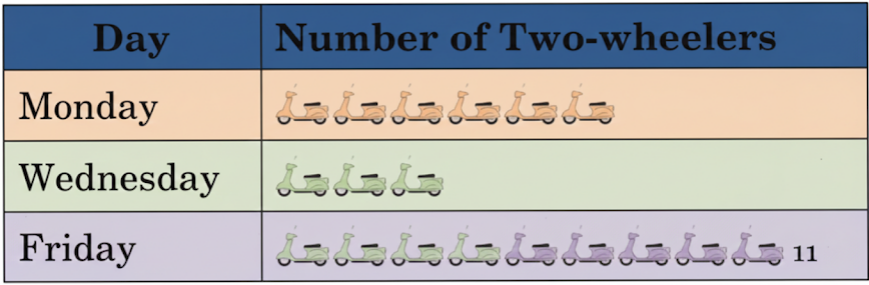
Two-wheelers on the Road
Deepti noted down the number of two-wheelers passing her house in one hour on three different days.
She used one icon to show 3 two-wheelers.
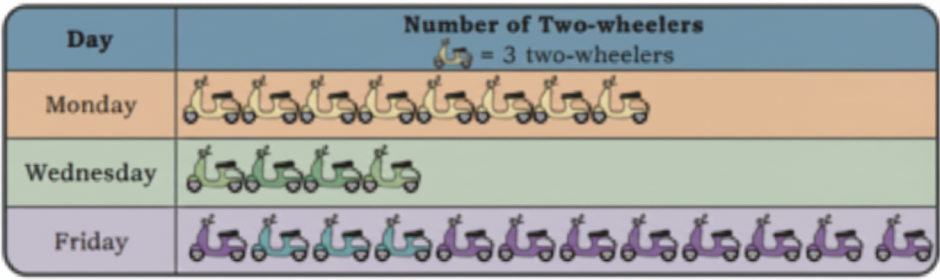
Observe the pictograph and answer the following questions.
Question 1. Which day had the most two-wheelers passing her house?
Solution: Friday has the highest number of symbols, so the maximum number of two-wheelers passed her house on that day.
Question 2. How many total two-wheelers did she record over three days?
Solution:
Monday: 8 × 3 = 24 two-wheelers
Wednesday: 4 × 3 = 12 two-wheelers
Friday: 12 × 3 = 36 two-wheelers
So, the total number of two-wheelers recorded by Deepti over the three days is
24 + 12 + 36 = 72 two-wheelers.
Question 3. How many fewer two-wheelers were seen on Wednesday than on Monday?
Solution:
On Monday, Deepti observed 24 two-wheelers, while on Wednesday, she saw 12 two-wheelers.
The difference is 24 − 12 = 12.
Therefore, 12 fewer two-wheelers were seen on Wednesday than on Monday.
Question 4. How many more two-wheelers were seen on Friday than on Wednesday?
Solution:
On Wednesday, Deepti observed 12 two-wheelers, and on Friday, she saw 36 two-wheelers.
The difference is 36 − 12 = 24.
So, 24 more two-wheelers were seen on Friday than on Wednesday.
Question 5. Choose any other scale and represent the same data using a pictograph in your notebook.
Solution:
Here 1 = 4 two-wheelers
Answers might be different
NCERT Textbook Pages 182-183
Recording a Day
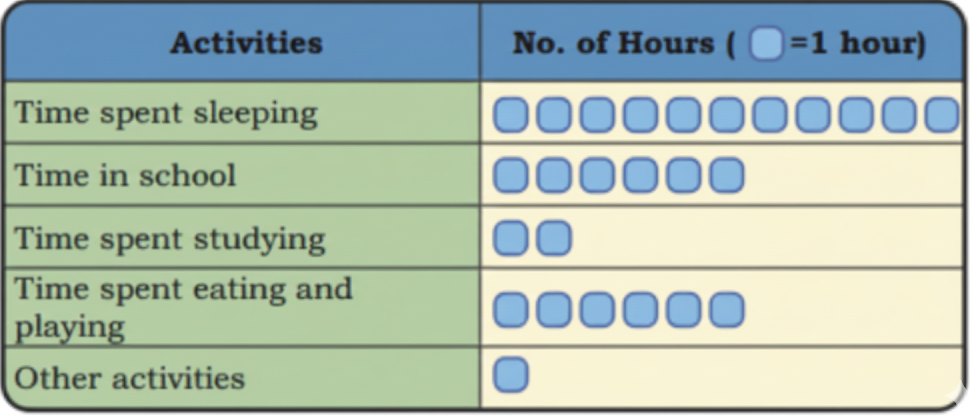
One day Raman and Sheela decided to record how they spent their day.
Raman recorded his daily routine in the table below.
Sheela recorded her routine in the following manner.
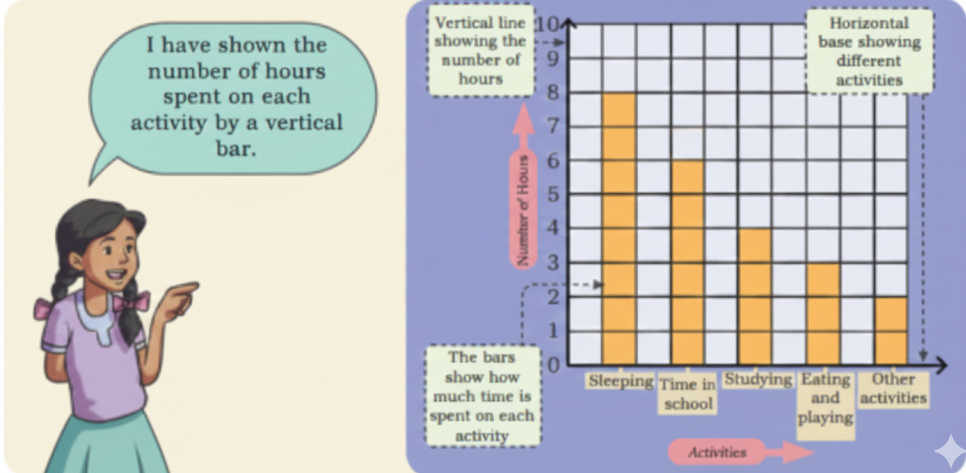
Observe Raman’s and Sheela’s routines and answer the following questions.
Question 1. Whose daily routine shows more time spent on sleeping?
Solution:
Raman spent 9 hours sleeping, while Sheela spent 8 hours.
Therefore, Raman’s daily routine shows more time spent on sleep.
Question 2. Who spends more hours in the school?
Solution:
Raman spends 6 hours in school, while Sheela spends 7 hours.
Hence, Sheela spends more time in school.
Question 3. How many more hours does Sheela spend studying compared to Raman?
Solution:
Sheela spends 4 hours studying, while Raman spends 2 hours.
The difference is 4 − 2 = 2 hours.
So, Sheela studies 2 hours more than Raman.
Question 4. Is there any activity on which they spend the same amount of time? If yes, name the activity.
Solution: No, there is no activity in which they spend the same amount of time.
Question 5. Based on their data, whose routine do you think is more balanced? Why?
Solution: Sheela’s routine seems more balanced, with a proper distribution of time for sleep, study, and other activities.
NCERT Textbook Pages 183-184
Day in My Life
Record your daily routine (24 hours) in hours and minutes, as necessary. Note the time spent on activities like sleeping, studying, playing, eating, and others.
Solution: Students should do it by themselves.
Make a bar graph of the time you spend on different activities in the space given below.
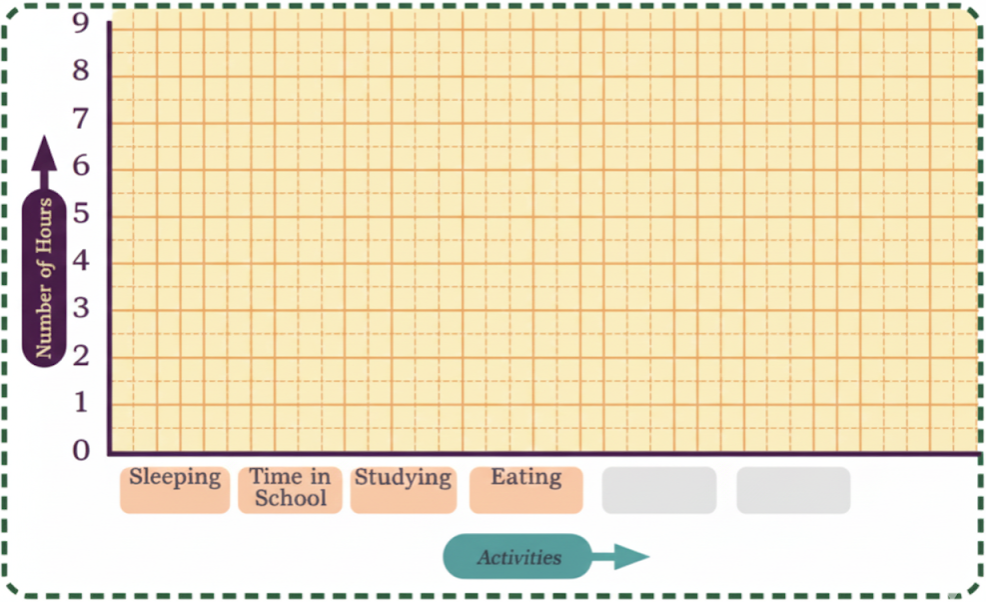
Solution: Students should do it by themselves.
NCERT Textbook Pages 184-185
Whose Index Finger is Longer?
Cut long paper strips from waste paper. Give one strip (each of the same width) to each of your friends. Now, put the paper strip on your index finger and tear off the extra strip extending above your fingers.
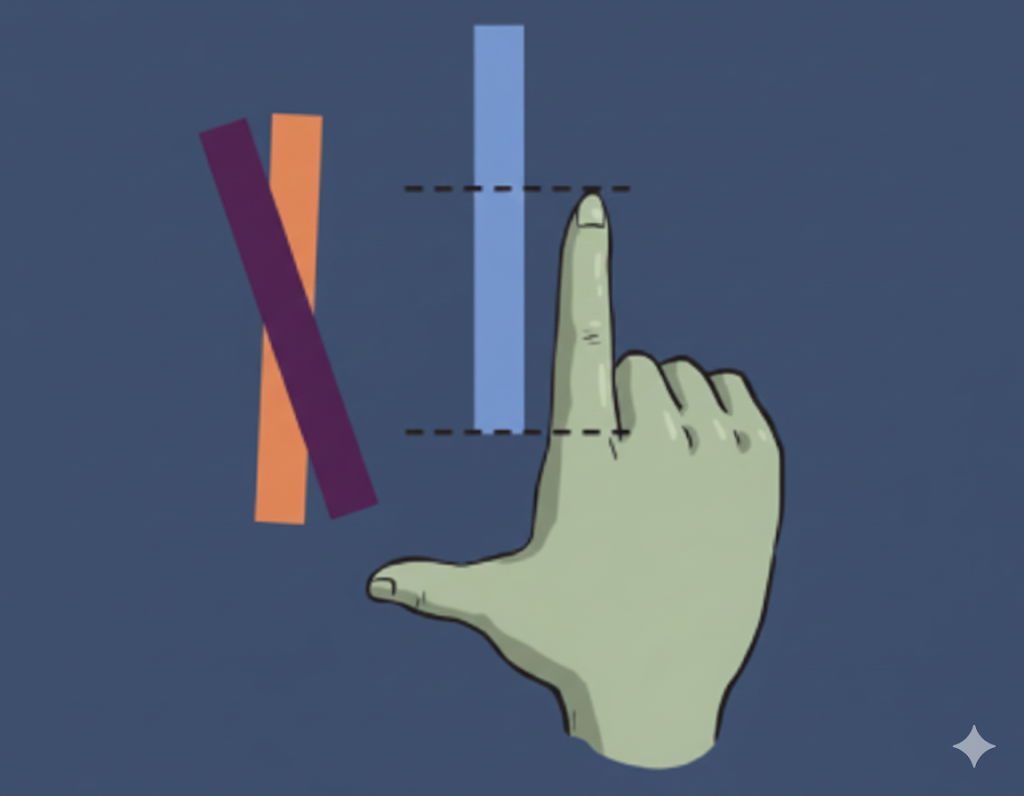
Paste these paper strips along the horizontal line in the given bar graph.
Paste the strips in the space given below.
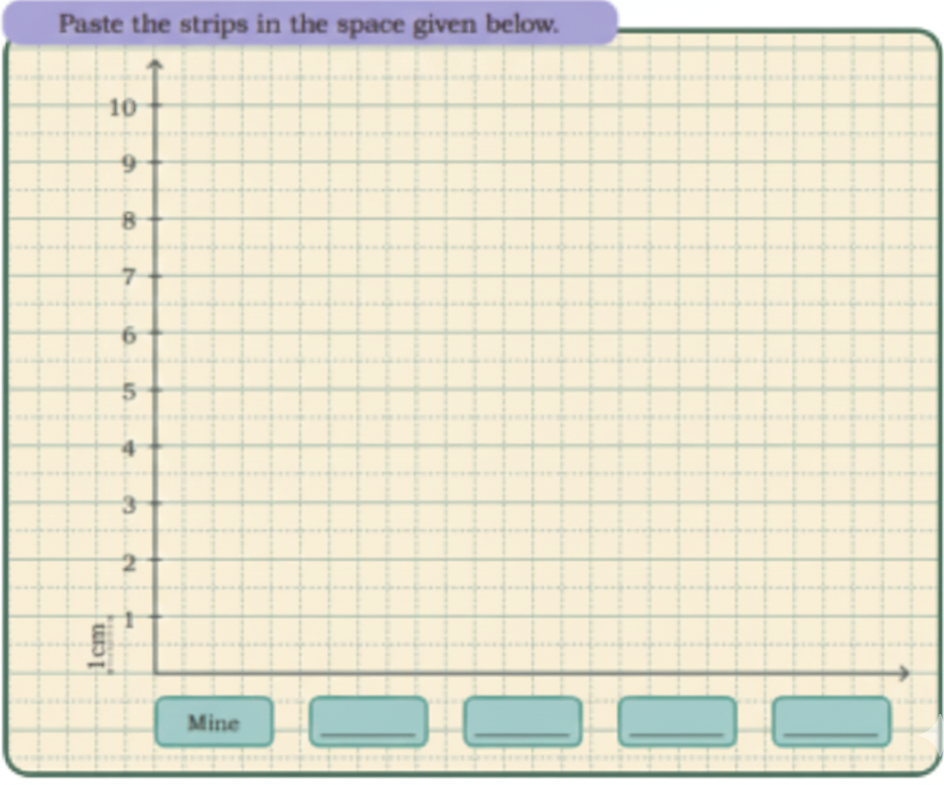
Solution: Students should do it by themselves.
Write the answers to the following questions based on your graph.
Question 1. Whose index finger is the longest?
Solution: Students should do it by themselves.
Question 2. The length of the longest index finger is _________ cm.
Solution: Students should do it by themselves.
Question 3. The smallest index finger is _________
Solution: Students should do it by themselves.
Question 4. It belongs to _________.
Solution: Students should do it by themselves.
NCERT Textbook Pages 185-186
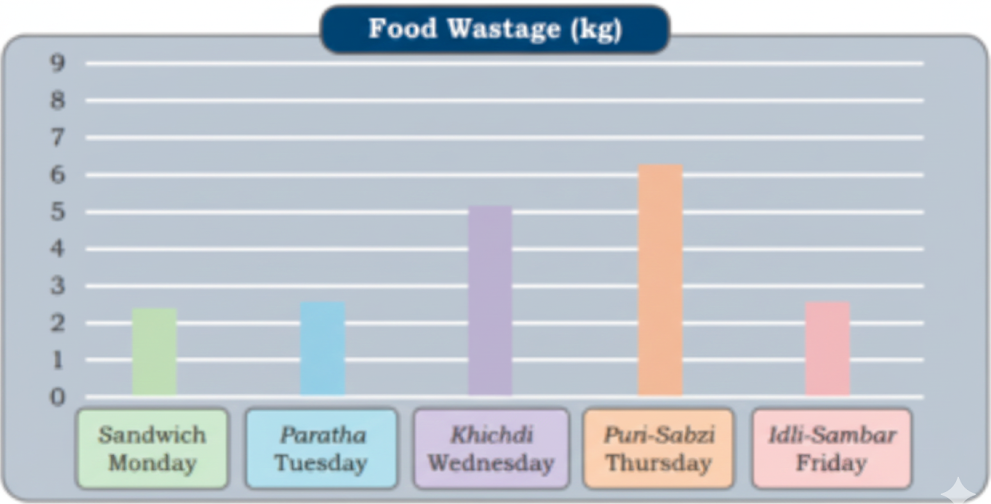
Food Wastage in the School Canteen
Rani stays in a residential school. Her school’s dining hall displays the amount of food wasted and the number of children the food could have fed. Given below is the data collected over the weekdays for different food items.
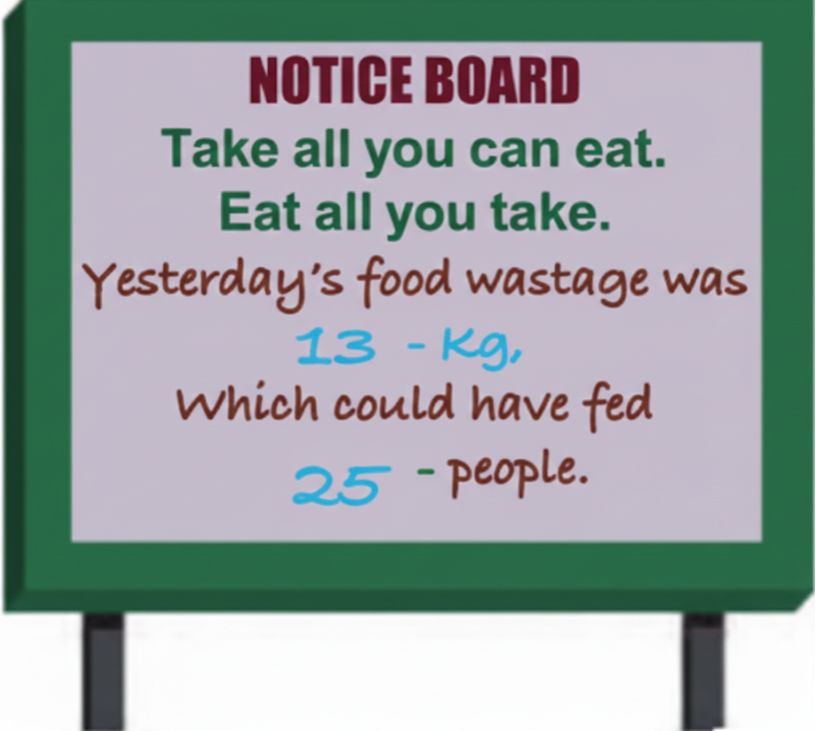
Given below is the data collected over the weekdays for different food items.
Rani was shocked to see the data. What do you think about food wastage? How can we reduce the wastage of food? What can we do with the leftover food?
Solution:
Food wastage is a serious issue because many people go hungry while edible food is thrown away. Therefore, we should take only as much food as we can finish.
To reduce wastage, we can plan our meals carefully, store food properly, and reuse leftovers by making items like sandwiches or cutlets. Fresh leftover food can also be shared with people who need it.
Observe the above graph and answer the following questions.
Question 1. Which food item had the highest amount of wastage? _____________
Solution: Khichdi had the maximum food wastage, amounting to 8 kg.
Question 2. Which food item had the least amount of wastage? _______________
Solution: Idli-Sambhar had the lowest amount of wastage, which was 4 kg.
Question 3. How much total food wastage was recorded in these days? _________
Solution: The total food wastage recorded from Monday to Friday is
5 + 6 + 8 + 7 + 4 = 30 kg.
Question 4. If 1 kg of food waste can feed 3 children, how many children could have been fed with the total food wasted?
Solution:
1 kg of food waste can feed 3 children.
30 kg of food waste can feed 3 × 30
= 90 children.
Question 5._________ day had less food wastage than day.
Solution: Monday had lower food wastage compared to Tuesday.
(Answers might be different.)
Question 6. If the same food items are to be repeated next week, can you predict which food item is likely to be wasted the most?
Solution:
Khichdi is likely to have the highest food wastage next week.
NCERT Textbook Page 187
True or False
Observe the above picture carefully. Based on your observation, find out which of the following statements are true or false.
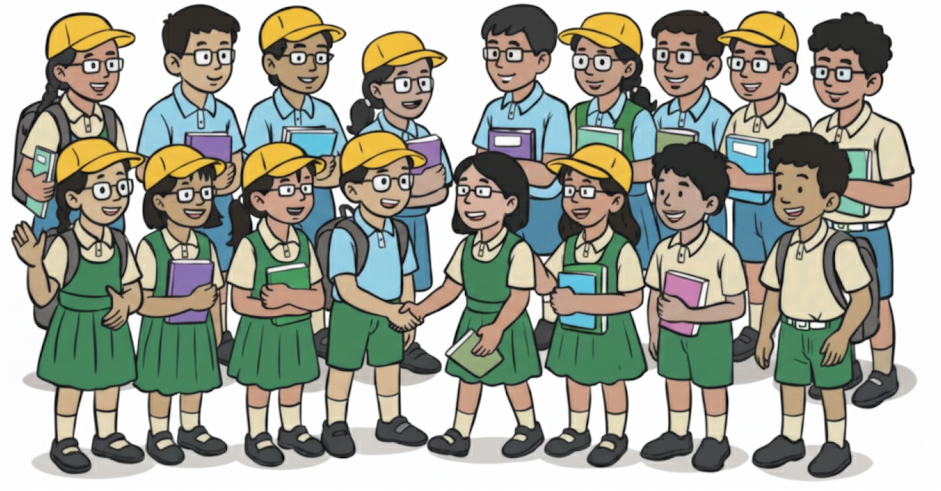
Observe the above picture carefully. Based on your observation, find out which of the following statements are true or false.
Solution:
Question 1. All girls are wearing glasses.
Solution: Only some girls are wearing it, not all of them.
Question 2. 10 children are wearing caps on their heads.
Solution: There are exactly 10 children wearing caps.
Question 3. More boys are holding books than girls.
Solution: The same number of boys and girls are holding books.
Question 4. More than half of the children are wearing glasses.
Solution: Fewer than half of the children are wearing glasses.
Question 5. The number of children holding books is greater than the number of children wearing caps.
Solution: More children are holding books than wearing caps.
Question 6. The number of boys wearing glasses is greater than the number of girls wearing glasses.
Solution: A greater number of boys are wearing glasses compared to girls.
Class 5 Maths Data Through Pictures – Practice and Strategy
Mastering data representation is crucial for excelling in NCERT Solutions Class 5 Maths Mela Chapter 15. With pictographs and bar graphs, students learn to present information visually, making maths both effective and engaging.
Exploring exercise-based questions will help students deepen their understanding of topics like data collection and graphical analysis. Regular revision using the 2026-27 NCERT syllabus improves accuracy and confidence in exams.
Develop a solid foundation by practicing charts and tables. Focus on key concepts and use tips from classroom discussions to boost your problem-solving and data interpretation skills for Class 5 maths success.
FAQs on NCERT Solutions For Class 5 Maths Chapter 15 Data Through Pictures - 2026-27
1. What are NCERT Solutions for Class 5 Maths Mela Chapter 15 Data Through Pictures?
NCERT Solutions for Class 5 Maths Mela Chapter 15 Data Through Pictures provide step-by-step answers, clear explanations, and diagrams to all textbook questions, helping students understand and master data representation in the syllabus for CBSE 2026–27.
Key features include:
- Detailed, exercise-wise solutions for all NCERT questions
- Well-labeled diagrams and charts as per exam guidelines
- Definitions, important formulas, and revision tips
- Exam-ready structure matching the CBSE marking scheme
- Free downloadable PDF for offline study
2. How can I score full marks using NCERT Solutions Class 5 Maths Chapter 15?
To score full marks in Class 5 Maths Chapter 15 Data Through Pictures:
- Write answers in clear, stepwise format
- Include neat and labeled diagrams or pictorial charts as asked
- Use keywords and definitions given in the solutions
- Follow CBSE answer structure and highlight important steps
- Avoid common mistakes by revising sample solutions
3. Are diagrams or definitions required in Class 5 Maths Chapter 15 answers?
Yes, diagrams and definitions are often necessary in answers for Chapter 15.
- Diagrams help illustrate data representation (like pictographs or bar charts) and fetch easy marks.
- Definitions of key terms (like 'pictograph' or 'data') should be precise and are frequently needed.
- Use labels, headings, and neat sketches for better clarity.
4. Where can I download the free PDF for NCERT Solutions Class 5 Maths Mela Chapter 15?
You can download the free PDF of NCERT Solutions for Class 5 Maths Mela Chapter 15 Data Through Pictures directly from the solutions page.
- Look for the "Download PDF" button near the top of the chapter page
- Ensure the PDF covers all exercise-wise answers for offline study
- The file is exam-ready and updated for CBSE 2026–27
5. What are the most important questions in Data Through Pictures Class 5?
The most important questions in Class 5 Maths Chapter 15 Data Through Pictures usually cover:
- Interpreting pictographs and answering related questions
- Creating your own pictographs from data
- Definitions of data, chart, and pictograph
- Drawing simple data tables and diagrams
- Short answer and higher-order/application questions from back/exemplar exercises
6. How should I present long answers for Class 5 Maths Data Through Pictures chapter?
For long answers in Class 5 Maths Chapter 15, use a structured approach:
- Begin with a short introduction or definition
- Write every calculation and step clearly
- Use bullet points or numbered steps for harder questions
- Add neat, labeled diagrams where necessary
- Highlight final answers and keywords
7. What common mistakes should I avoid while answering NCERT Class 5 Maths Chapter 15 questions?
Avoiding common mistakes in Class 5 Maths Chapter 15 will help you score better:
- Not labeling diagrams or pictographs
- Missing out key steps in explanation
- Incorrect data representation (wrong symbols or units)
- Neglecting to write definitions where required
- Ignoring the format suggested by NCERT
8. What are the key definitions and formulas covered in Class 5 Maths Mela Chapter 15?
Chapter 15 Data Through Pictures covers these main definitions and terms:
- Data: Information collected in the form of numbers, symbols, or words
- Pictograph: A representation of data using pictures or symbols
- Bar Chart (if included): Data shown using rectangular bars
- Basic formula: Total quantity = Number of symbols × Value per symbol
9. Are NCERT Solutions enough for Class 5 Maths exams?
NCERT Solutions for Class 5 Maths are generally sufficient for CBSE examination preparation, as they:
- Cover all textbook exercises and intext questions
- Follow the official CBSE marking pattern
- Provide stepwise explanations, ensuring conceptual clarity
10. How can I revise Class 5 Maths Data Through Pictures chapter quickly?
To quickly revise Class 5 Maths Chapter 15 Data Through Pictures:
- Read quick notes and summary tables from revision guides
- Practice 2–3 sample pictograph and data questions
- Review definitions of key terms
- Go through the free PDF solutions for stepwise answers
- Attempt MCQs and important questions for practice
11. Do examiners award partial marks for correct steps even if the final answer is wrong?
Yes, CBSE examiners usually award partial marks for correct steps, even if the final answer has a calculation mistake:
- Each correct step (drawing data, plotting points, using correct format) fetches marks
- Final answer matters, but steps are rewarded as per the marking scheme
- Always show your work clearly to maximize step marks
12. Where can I find chapterwise solutions PDF for offline study?
You can get chapterwise NCERT Solutions PDF for Class 5 Maths, including Chapter 15, from leading educational websites.
- Look for a Download PDF or similar button on the chapter page
- Ensure solutions are updated for CBSE 2026–27
- These PDFs help with seamless, offline revision anytime