


NCERT Solutions For Class 3 Maths Chapter 13 Time Goes On - 2026-27
Class 3 Maths NCERT Solutions for Chapter 13, With colourful pictures and engaging activities, Students will feel on an exciting adventure while learning important skills. This chapter helps students learn about time, including reading clocks and understanding hours and minutes. The solutions offer clear explanations and practice problems to make learning about time easy and fun. These solutions are a great resource for both learning and revision. Check out the revised CBSE Class 3 Maths Syllabus and start practising Maths Class 3 Chapter 13.
 Table of Content
Glance on Class 3 Maths Chapter 13 - Time Goes On
Learn to read clocks and understand the difference between hours and minutes.
Practice with easy examples to help grasp how time is measured and recorded.
Relate time concepts to everyday activities like scheduling and planning.
Engage with activities that make learning about time fun and practical.
This chapter provides a strong foundation for understanding time, essential for managing daily routines.
Appa bought a new calendar,
Amma points a big blunder.
Missing was the month of July,
I wonder, where did it fly?
Don’t worry, don’t worry,
I have a solution to your query.
July and January looks the same,
Let us play the calendar game.
Let us Do
Make the calendar for the month of July 2024.
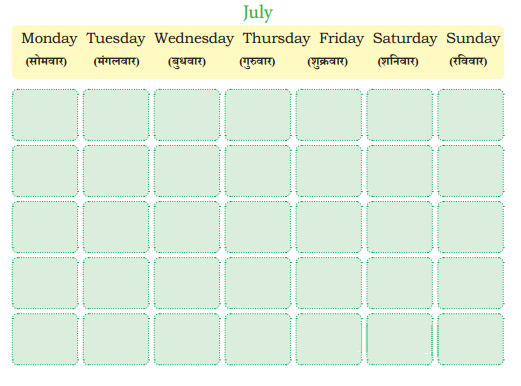
Answer:
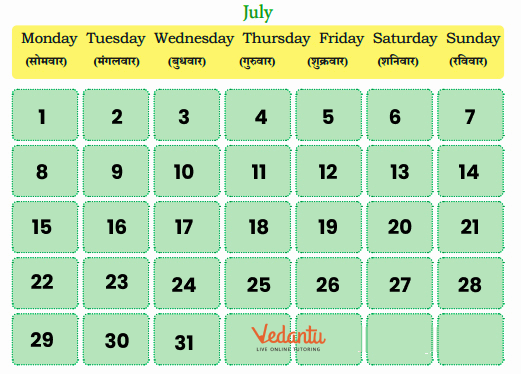
Observe the July month and complete the following.
Question 1. Number of Sundays _______
Answer: Number of Sundays 4.
Question 2. Write the dates in this month that are Thursdays _______
Answer: The dates in this month that are Thursdays – 4, 11, 18 and 25.
Question 3. Three days after July 22 is July ______.
The day on this date is ______
Answer: Three days after July 22 is July 25.
The day on this date is Thursday.
Question 4. A school closes on July 7 for 15 days. The date on which the school will open is ________
Answer: A school closes on July 7 for 15 days. The date on which the school will open is 22.
Let us Explore
Collect calendars for the last two years. Observe the following in both the calendars:
Question 1. What is the same? What is changing in the years?
Tick (✓) the correct answer.
(a) Names of the months Same/ Changes
(b) Days in a month Same/ Changes
(c) Days in a week Same/ Changes
(d) Number of Sundays Same/ Changes
(e) Number of weeks in a year Same/ Changes
Answer:
(a) Same (✓)
(b) Same (✓)
(c) Same (✓)
(d) Changes (✓)
(e) Same (✓)
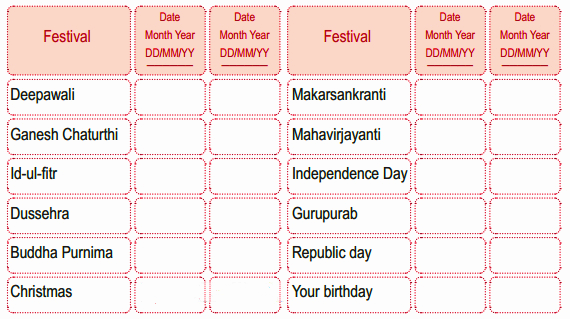
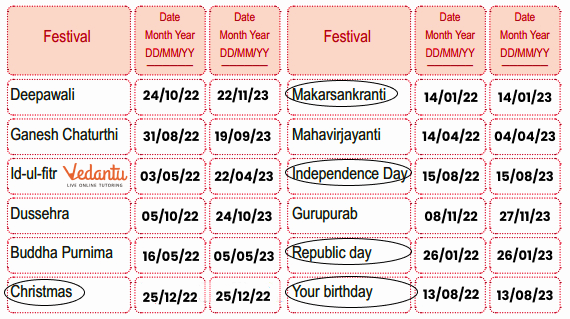
Circle the festivals that fall on the same date.
Answer:
Let us Do
Question 1. Write the names of the 12 months in a year.
Answer:
January
February
March
April
May
June
July
August
September
October
November
December
Question 2. Months that have less than 30 days ______
Answer: Months that have less than 30 days is February.
Question 3. Number of days in a year ______
Answer: Number of days in a year 365.
Question 4. Hetal says there are 53 weeks in a year. Is she right? Yes/No. If not, how many weeks did you find in a year?
Answer: No. We find 52 weeks in a year.
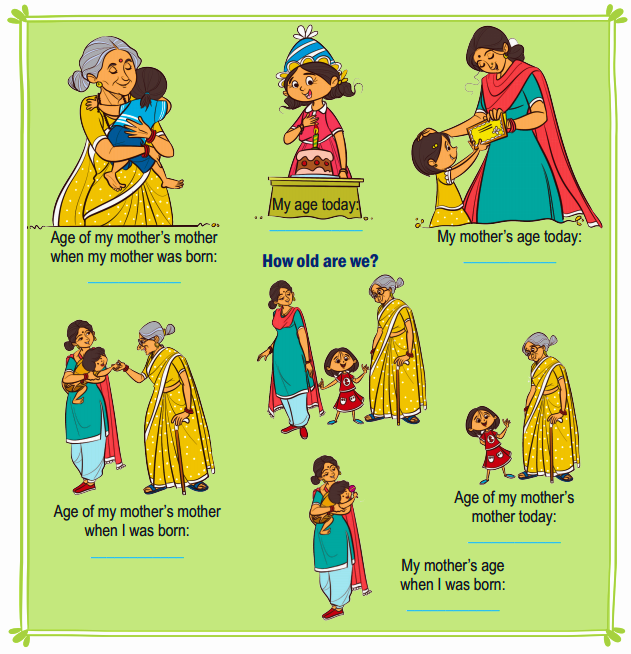
Age Fun
Talk to your mother and find the following.
Hetal is twice as old as her brother. She is also 10 years older than her brother. Guess the age of Hetal and her brother.
Answer: Hetal is 20 years old and her brother is 10 years old.
Let us Do
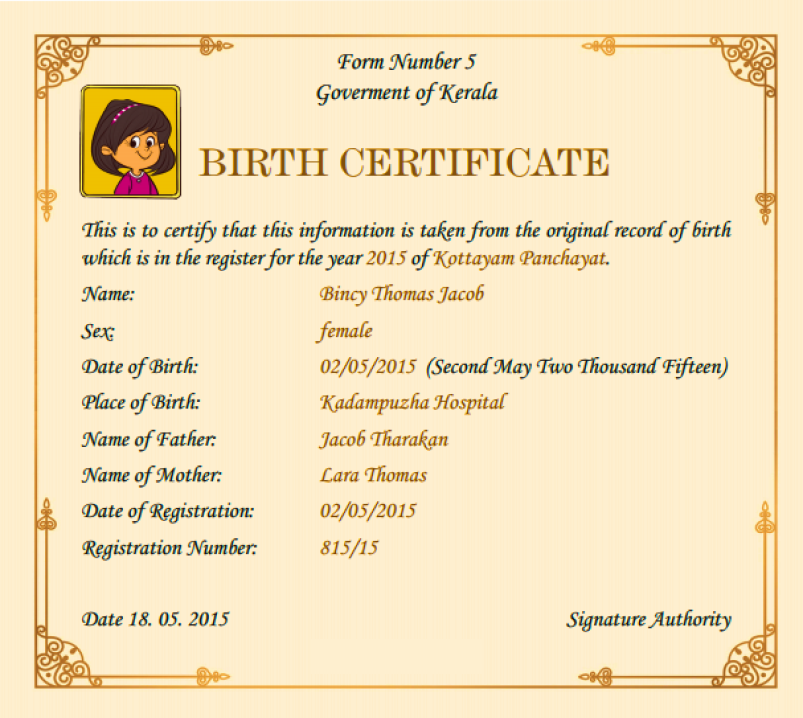
Look at the birth certificate of Bincy and answer the following question.
Question 1. 2/5/2015 shows that Bincy was born on 2 (April/May/ June/July) in the year 2015.
Answer: 2/5/2015 shows that Bincy was born on 2 (April/May/ June/July) in the year 2015.
Question 2. How old will Bincy be on 2 May 2025? ______
Answer: Bincy will be 10 years old on 2 May 2025.
Question 3. How old will she be in 2030? ______
Answer: She will be 15 years old in 2030.
Question 4. Eighth Birthday of Bincy was on ____.
Answer: Eighth Birthday of Bincy was on 02/05/2023.
Question 5. Bincy was ____ months old on 2 August 2015.
Answer: Bincy was 3 months old on 2 August 2015.
Question 6. After how many days of her birth was the certificate issued? ____
Answer: After 16 days of her birth the certificate was issued.
Let us Do
Question 1. Make your own birth certificate.
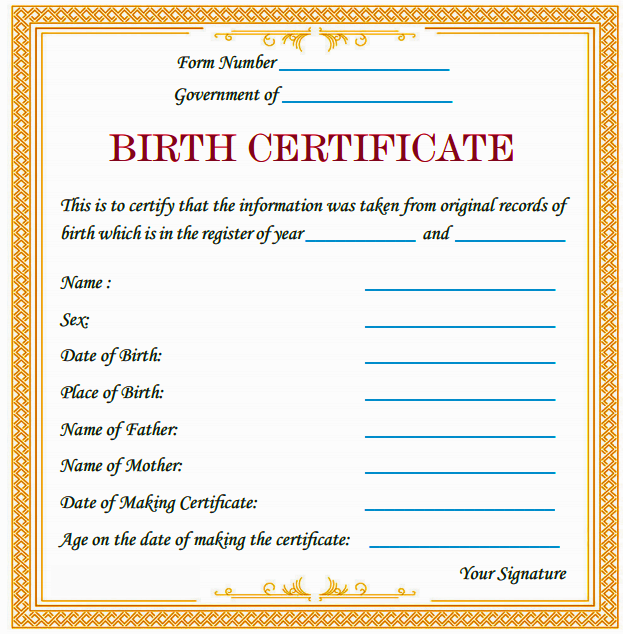
Answer:
Do yourself.
Question 2. Complete the following by writing the dates in the boxes given below:
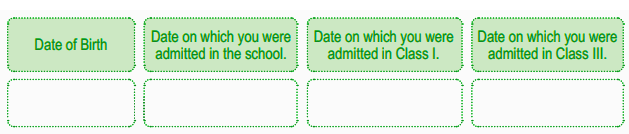
Answer: Do yourself.
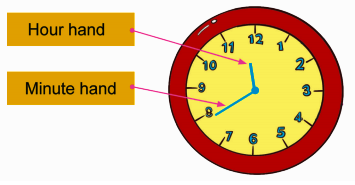
Let us Play
Get a working analog clock or watch. Observe the face of the clock and movements of the hands. Discuss what you observe.
Let us Do
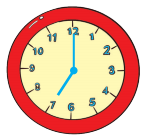
Question 1. Hetal started her breakfast at 7 o’clock in the morning. She finished her breakfast at 07:15 in the morning.
(a) 07:00
(b) 07:15
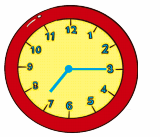
She took _____ minutes to eat her breakfast. How do you know?
Answer:
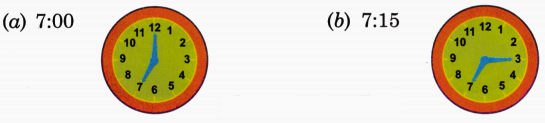
She took 15 minutes to eat her breakfast. We know that by seeing the minute and hour hand of the clock.
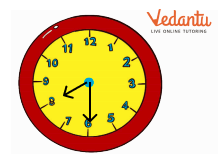
Question 2. Draw the hour hand and minute hand on the clock to show the following:
(a) 8 : 15 or quarter past 8

Answer:
(a) 8 : 15 or quarter past 8
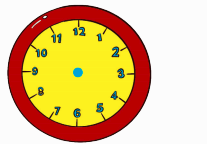
(b) 8:30 or half past 8
Answer:
8:30 or half past 8
Let us Do
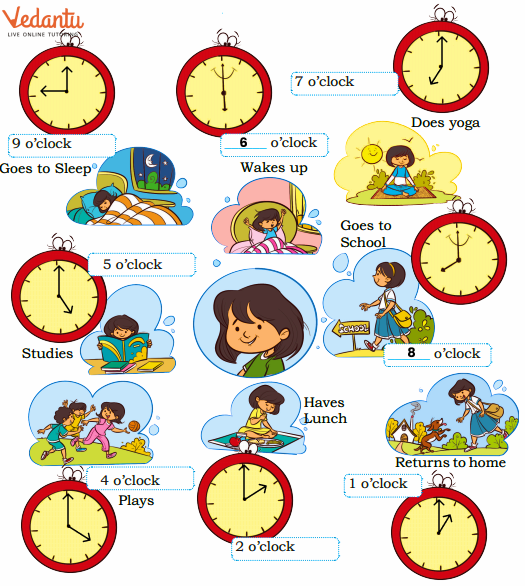
A Day in the life of Hetal.
Match the activity with the statement shown in the picture.
Write the time and draw the minute hand and the hour hand wherever it is required.
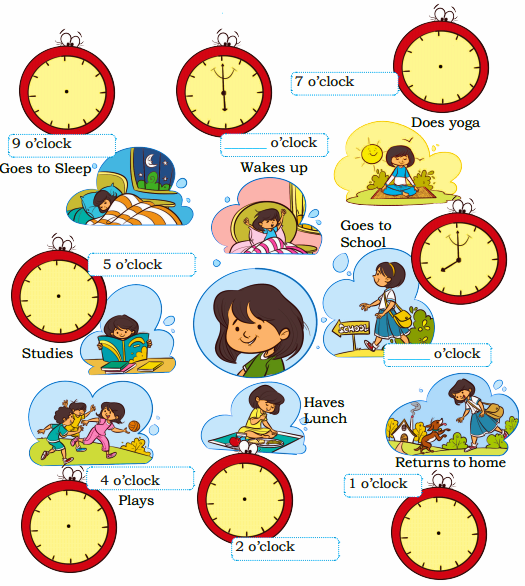
Answer:
Visit to Nani’s House (Grandma’s House)
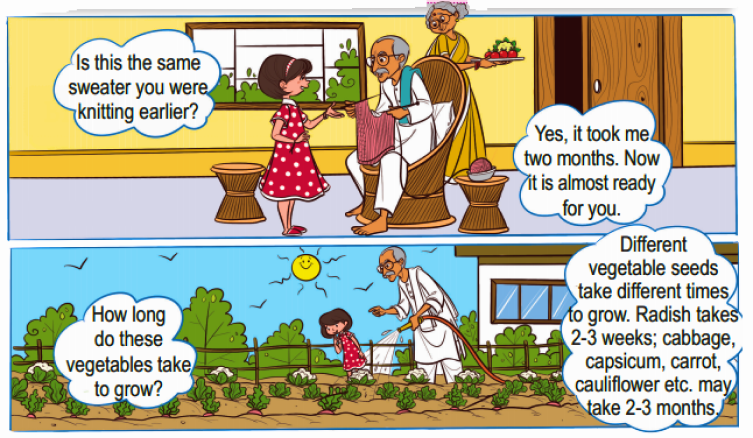
Let us Think
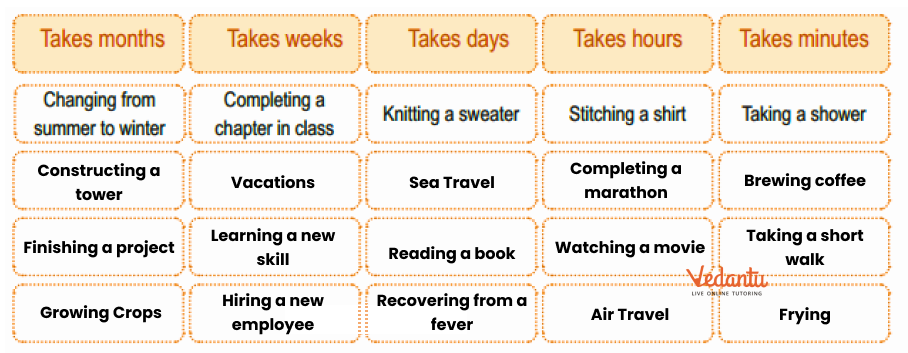
Fill the table by writing events or activities from your daily life that can take the following durations of time. One is written as an example in each column.
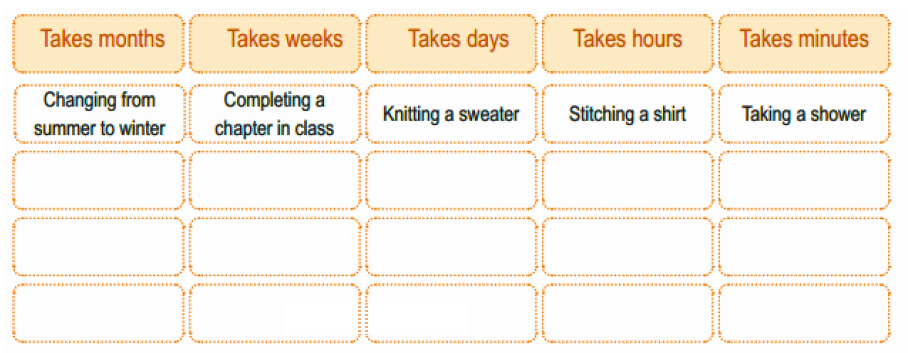
Answer:
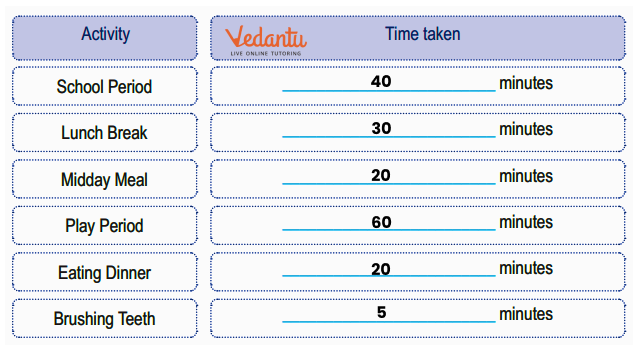
Question 3. Write the number of minutes taken for the following activities.
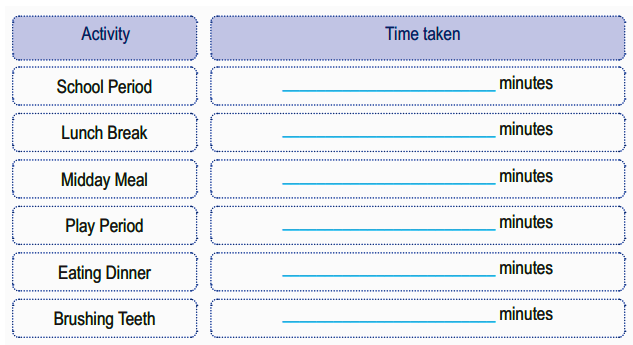
Answer:
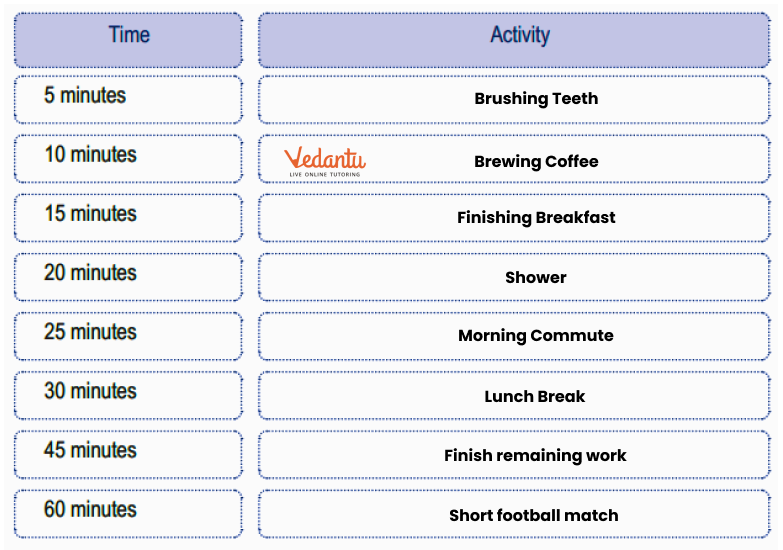
Question 4. Write down what you can do in the time frame given below.
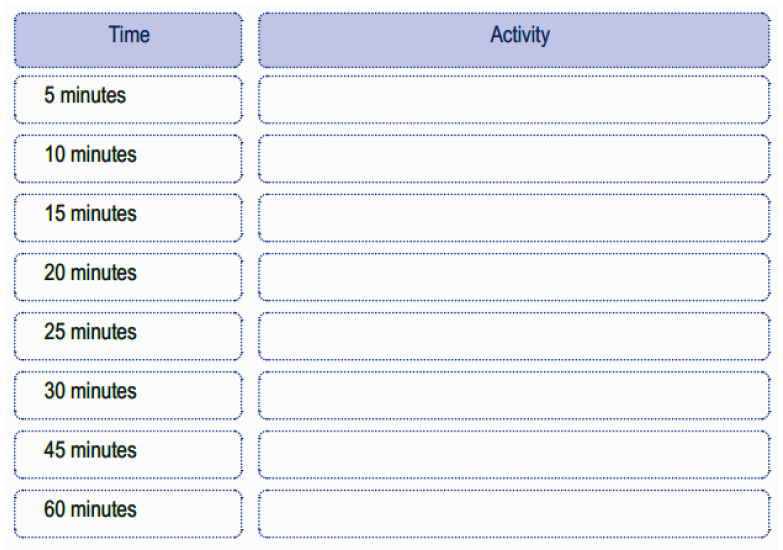
Answer:
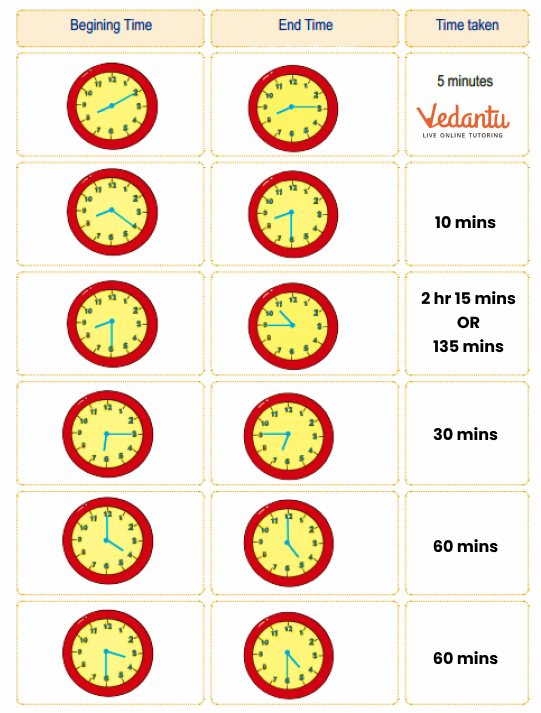
Question 5. Write the number of minutes passed by looking at the movement of the minute and hour hands.
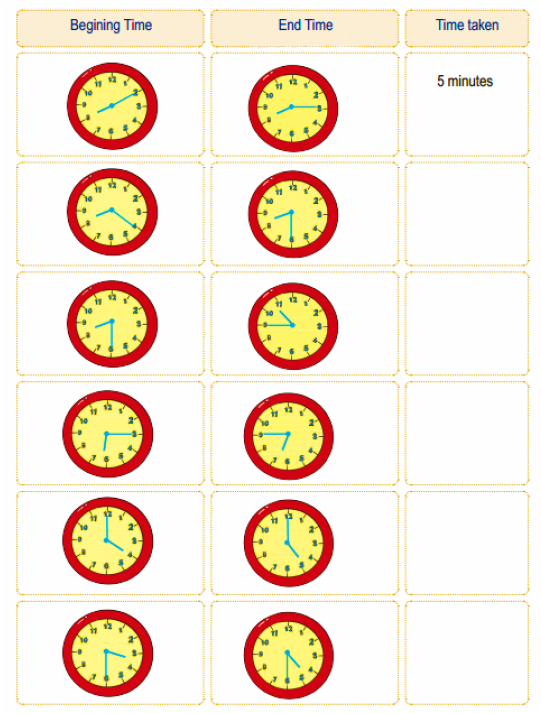
Answer:
Let us Explore
You may have seen digital watches or clocks at various places. Where have you seen them?
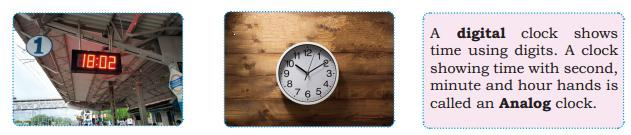
Question 1. What is the difference between the above two clocks?
Answer: Clock 1 is digital clock and the second clock 2 is analog clock.
Question 2. Which clock do you have on your school wall?
Answer: I have Analog clock on my school wall.
Duration of time is also measured using sand clocks. Make your own sand clock (timer), in the presence of an adult.
Material Required:
(i) Two waste transparent or glass bottles of small size with caps.
(ii) Strong glue to join bottle caps.
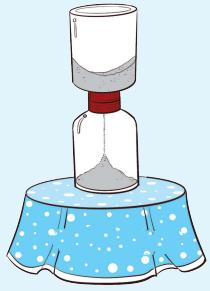
Process:
Join the tops of the bottle caps with each other using a strong glue.
Make a small hole with a fine needle at the centre of the joined caps.
Fill one of the bottles half way with fine sand and close the bottle with the joined caps.
Attach the second bottle on the other side of the joined caps.
Find out how much time it takes to shift the sand from one bottle to the second one by looking at the clock. Your sand clock is ready for use. You may use it to time while playing different games.
Benefits of NCERT Solutions for Class 3 Maths Chapter 13 Time Goes On
Easy Learning: The solutions break down how to read clocks and measure time into simple steps.
Practical Examples: Learn with real-life examples that show how time is used in daily activities.
Step-by-Step Guidance: Each problem is solved with clear explanations, helping you understand how to find the time accurately.
Improved Skills: Practising problems helps you get better at reading time and understanding hours and minutes.
Convenient Access: The FREE PDF can be downloaded and accessed anytime, making it easy to study whenever you need.
Important Study Material Links for Maths Chapter 13 Class 3 - Time Goes On
Conclusion
CBSE Class 3 Chapter 13, "Time Goes On," helps students learn basic math concepts of time and clock reading in a fun and engaging way. Through relatable examples and enjoyable activities, students build a strong foundation in math, making the subject enjoyable and easy to understand. This chapter not only strengthens their math skills but also encourages them to see the practical side of learning.
Chapter-wise NCERT Solutions Class 3 Maths
After familiarising yourself with the Class 3 Maths Chapter 13 Question Answers, you can access comprehensive NCERT Solutions for all Chapters in Class 3 Maths.
Related Important Links for Maths Class 3
Along with this, students can also download additional study materials provided by Vedantu for Maths Class 3.

FAQs on NCERT Solutions For Class 3 Maths Chapter 13 Time Goes On - 2026-27
1. What key concepts are solved in the NCERT Solutions for Class 3 Maths Chapter 13, 'Time Goes On'?
The NCERT Solutions for this chapter provide step-by-step methods for solving problems related to the following key concepts from the CBSE 2026-27 syllabus:
- Reading time accurately on an analog clock.
- Using a calendar to identify dates, days, and months.
- Calculating simple time intervals and durations of activities.
- Sequencing events and understanding daily routines in relation to time.
2. How do the NCERT Solutions for Class 3 Maths Chapter 13 help in mastering the topic of time?
These solutions offer detailed, easy-to-follow explanations for every exercise in the NCERT textbook. They clarify the correct method to solve problems, such as reading a clock or interpreting a calendar, which helps students verify their answers and build a strong conceptual foundation.
3. What types of questions are addressed in the NCERT Solutions for 'Time Goes On'?
The solutions cover all the varied question formats from the textbook, including solving word problems based on a calendar, matching analog clocks with the correct time, filling in blanks about time duration, and answering questions based on personal timelines and daily activity schedules.
4. What is a common mistake students make when reading a clock, and how do the NCERT Solutions help prevent it?
A very common mistake is confusing the hour hand (short hand) and the minute hand (long hand). The NCERT Solutions address this by repeatedly illustrating and explaining their distinct functions in solved examples. This consistent practice helps students to correctly identify and read the time shown on a clock.
5. How do the NCERT Solutions explain solving problems related to a birth certificate or a calendar?
The solutions demonstrate the step-by-step method for extracting specific information from visuals like a birth certificate or a calendar. They show exactly how to find a person's age from their birth date or determine the day of the week for a given date, breaking down the process into simple, understandable steps.
6. Why is understanding a timeline important, as shown in the solved problems of Chapter 13?
Understanding a timeline is crucial for learning to sequence events chronologically. The NCERT Solutions for 'Time Goes On' solve exercises that require arranging events in the correct order. This builds a foundational skill for understanding history, personal growth, and the logical flow of time.
7. What is the correct method taught in the NCERT Solutions for calculating the duration of an activity?
The solutions teach a simple counting-forward or subtraction method. For an activity that starts at 10:00 a.m. and ends at 10:45 a.m., the solutions show how to correctly count the minutes that have passed (45 minutes) to find the total duration. This step-by-step approach simplifies solving time-interval problems.
8. Beyond just providing answers, how do the solutions for 'Time Goes On' build a deeper understanding of time?
These solutions build a deeper understanding by connecting abstract concepts to a child's daily life. They solve practical problems about daily routines, like the time taken to eat breakfast or travel to school. This approach helps students see the real-world application of time measurement, making the concept more intuitive and memorable.