


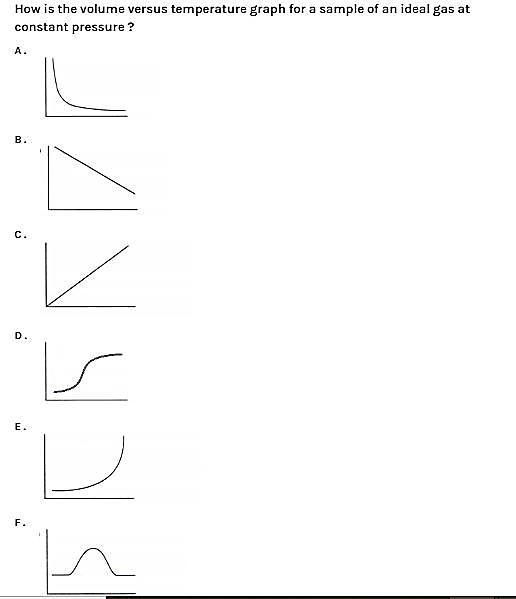
How is the volume versus temperature graph for a sample of an ideal gas at constant pressure?
Answer
248.4k+ views
Hint: To answer this question, we should know about the relationship between volume and temperature. This relationship was given by Charles’ law. By using this law we can easily find out the answer.
Complete step by step answer:
> To answer this question, we should know about Charles’ law. We should know that Charles’ law is one of the gas laws which explain the relationship between volume and temperature of a gas. Charles’s law states that when pressure is held constant, the volume of a fixed amount of dry gas is directly proportional to its absolute temperature. It should be noted that, when we take two measurements in direct proportion then any change made in one of them affects the other through direct variation. Charles’ Law is expressed by the equation:
\[\begin{align}
& V\alpha T \\
& \dfrac{V1}{T1}=\dfrac{V2}{T2} \\
\end{align}\]
> From the above expression we should know that V1 and V2 are the Initial Volumes and Final Volume respectively. T1 refers to the Initial Temperature and T2 refers to the Final Temperature.
> We can understand this by taking one example, we should know that on heating up a fixed mass of gas, that is, increasing the temperature, the volume also increases. Similarly, on cooling, the volume of the gas decreases.
So, from this we can now say that option C is correct. In this graph we can say that it is a straight line because volume and temperature are directly proportional.
Note: It is important to discuss that the unit Kelvin is preferred for solving problems related to Charles Law, and not Celsius. Kelvin (T) is also known as the Absolute temperature scale. We should know about Charles' law application in real life. It has a wide range of applications. Helium balloons shrink in a cold environment. Second example is this : while jogging in winters, we face difficulty because our lung capacity decreases.
Recently Updated Pages
JEE Isolation, Preparation and Properties of Non-metals Important Concepts and Tips for Exam Preparation
Isoelectronic Definition in Chemistry: Meaning, Examples & Trends
Ionisation Energy and Ionisation Potential Explained
Iodoform Reactions - Important Concepts and Tips for JEE
Introduction to Dimensions: Understanding the Basics
Instantaneous Velocity Explained: Formula, Examples & Graphs
Trending doubts
JEE Main 2026: Exam Dates, Session 2 Updates, City Slip, Admit Card & Latest News
Hybridisation in Chemistry – Concept, Types & Applications
Understanding the Electric Field of a Uniformly Charged Ring
JEE Main 2026 Application Login: Direct Link, Registration, Form Fill, and Steps
Derivation of Equation of Trajectory Explained for Students
Understanding the Angle of Deviation in a Prism
Other Pages
JEE Advanced Marks vs Ranks 2025: Understanding Category-wise Qualifying Marks and Previous Year Cut-offs
JEE Advanced 2026 - Exam Date (Released), Syllabus, Registration, Eligibility, Preparation, and More
CBSE Notes Class 11 Chemistry Chapter 9 - Hydrocarbons - 2025-26
CBSE Notes Class 11 Chemistry Chapter 5 - Thermodynamics - 2025-26
CBSE Notes Class 11 Chemistry Chapter 8 - Organic Chemistry Some Basic Principles And Techniques - 2025-26
JEE Advanced Weightage 2025 Chapter-Wise for Physics, Maths and Chemistry