


The graph between ${v^2}$ versus $s$ of a particle moving in a straight line is as shown in figure. From the graph some conclusions are drawn. State which statement is wrong?
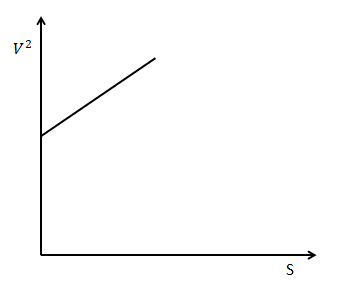
$\left( A \right)$ The given graph shows uniform acceleration motion.
$\left( B \right)$ Initial velocity of the particle is zero.
$\left( C \right)$ Corresponding $s - t$ graph will be a parabola.
$\left( D \right)$ None of the above.
Answer
232.8k+ views
Hint: Here the graph is drawn with velocity square along the x axis and displacement along the y axis. The tangent to the angle made by the line with the x axis gives the slope of the straight line. Using the ${v^2}$ versus $s$ graph, write the equation of a line and compare it to the kinematic equation. By comparing we will be able to tell about its acceleration, initial acceleration.
Formula used:
$y = mx + c$
Where y is the value where the line cuts y axis.
${v^2} = {u^2} + 2as$
Where $v$ is the final velocity, $u$ is the initial velocity, $a$ is the acceleration, $s$ is the displacement.
Complete step by step solution:
Graphical analysis is a convenient method to study the motion of studying the motion of a particle. The motion situation of a particle can be effectively analysed by graphical representation.
For graphical representation, we require two coordinate axes. The usual practice is to take the independent variable along the x axis and dependent variable along the y axis.
First from the graph ${v^2}$ versus $s$ let us write the line equation:
${v^2} = cs + {c_1}$
Where $c$ and ${c_1}$ are constants
Kinematic equation of motion
${v^2} = 2as + {u^2}$
Comparing the two equations we can say the acceleration is uniform.
Since acceleration is uniform, we can $s \propto {t^2}$. Hence $s - t$ graph will be a parabola.
If $s = 0$ in the equation ${v^2} = cs + {c_1}$, we get ${v^2} = {c_1}$ from this we can say that initial velocity is not zero.
Hence option $\left( B \right)$ is the right option.
Note: The tangent to the angle made along the x axis gives the slope of the straight line. The motion situation of a particle can be effectively analysed by graphical representation. Graphical analysis can be effectively applied to analyse the motion situation of a particle. A graph can be drawn by using the two coordinates one along the x axis and one along the y axis. Here the x axis contains an independent variable.
Recently Updated Pages
JEE Main 2023 April 6 Shift 1 Question Paper with Answer Key
JEE Main 2023 April 6 Shift 2 Question Paper with Answer Key
JEE Main 2023 (January 31 Evening Shift) Question Paper with Solutions [PDF]
JEE Main 2023 January 30 Shift 2 Question Paper with Answer Key
JEE Main 2023 January 25 Shift 1 Question Paper with Answer Key
JEE Main 2023 January 24 Shift 2 Question Paper with Answer Key
Trending doubts
JEE Main 2026: Session 2 Registration Open, City Intimation Slip, Exam Dates, Syllabus & Eligibility
JEE Main 2026 Application Login: Direct Link, Registration, Form Fill, and Steps
Understanding the Angle of Deviation in a Prism
Hybridisation in Chemistry – Concept, Types & Applications
How to Convert a Galvanometer into an Ammeter or Voltmeter
Understanding Uniform Acceleration in Physics
Other Pages
JEE Advanced Marks vs Ranks 2025: Understanding Category-wise Qualifying Marks and Previous Year Cut-offs
Laws of Motion Class 11 Physics Chapter 4 CBSE Notes - 2025-26
Waves Class 11 Physics Chapter 14 CBSE Notes - 2025-26
Mechanical Properties of Fluids Class 11 Physics Chapter 9 CBSE Notes - 2025-26
Thermodynamics Class 11 Physics Chapter 11 CBSE Notes - 2025-26
Units And Measurements Class 11 Physics Chapter 1 CBSE Notes - 2025-26