


Starting from rest a car moves with uniform acceleration and attains a velocity of $90{\text{km/h}}$ in \[25\;{\text{s}}\]. It then moves with uniform speed for $30\;{\text{s}}$ and is then brought to rest in \[20\;{\text{s}}\] under uniform retardation. Find total distance travelled using velocity - time graph.
Answer
266.1k+ views
Hint: In this question, the concept of the velocity time graph will be used, that is the area under the curve of the graph represents the total distance travelled. Plot the velocity-time graph according to the question given. Find the area of the graph which will give the result for total distance travelled using velocity - time graph.
Complete step by step answer:
Firstly, to solve this question, we have to convert the velocity given for the car in ${\text{m/s}}$format.
So,
$ \Rightarrow 90{\text{km/h}} = 90 \times \dfrac{{1000}}{{360}}{\text{m/s}} = 25{\text{m/s}}$
Now, we plot the velocity-time graph (or the v-t graph) for the question, as shown below: -
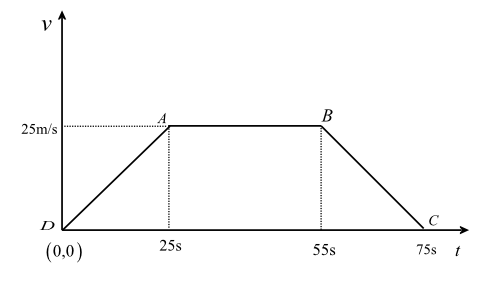
The above diagram represents the velocity time graph (v-t graph) for the question.
As we have given in the question, velocity of the car is plotted in the $y$-axis and time is plotted in the $x$ -axis.
In case of $x$ -axis (that is for plotting time): The car moves with uniform acceleration and attains a velocity of $25{\text{m/s}}$ in\[25{\text{ }}s\], so the first point is given as \[25{\text{ }}s\]. It then moves with uniform speed for$30s$, so the next point is given as $55\;{\text{s}}$ $(25 + 30 = 55s)$. Then the car is brought to rest in $20\;{\text{s}}$, so the last point is given as $75\;{\text{s}}$ $\left( {25 + 30 + 20 = 75\;{\text{s}}} \right)$.
Now, according to the formula for displacement, we have to calculate the Area under the velocity-time graph. (As Displacement= Area under velocity-time graph)
So we can clearly see in the figure that the figure forming in the velocity-time graph is a Trapezoid.
So,
\[ \Rightarrow {\text{Area of Trapezoid}} = \dfrac{1}{2} \times \left( {{\text{Sum of Parallel Sides}}} \right) \times \left( {{\text{Distance between them}}} \right)\]
Here, Parallel sides (according to the v-t graph) are \[AB\]and \[CD\]. And the distance between them is $25{\text{m/s}}$.
\[ \Rightarrow {\text{Area of Trapezoid}} = \dfrac{1}{2} \times \left( {AB + CD} \right) \times 25\]
Now, we substitute the given values as,
\[ \Rightarrow {\text{Area of Trapezoid}} = \dfrac{1}{2} \times (30 + 75) \times 25\]
After simplification we get,
\[ \Rightarrow {\text{Area of Trapezoid}} = 1312.5\;{\text{m}}\]
Hence, the total distance travelled using velocity-time graph is $1312.5\;{\text{m}}$.
Note: Mistakes occur while plotting the velocity-time graph. In $x$-axis, time plotted should be taken cautiously as the timestamps are summed up continuously and plotted. Conversion of units is done for the ease of calculation.
Complete step by step answer:
Firstly, to solve this question, we have to convert the velocity given for the car in ${\text{m/s}}$format.
So,
$ \Rightarrow 90{\text{km/h}} = 90 \times \dfrac{{1000}}{{360}}{\text{m/s}} = 25{\text{m/s}}$
Now, we plot the velocity-time graph (or the v-t graph) for the question, as shown below: -
The above diagram represents the velocity time graph (v-t graph) for the question.
As we have given in the question, velocity of the car is plotted in the $y$-axis and time is plotted in the $x$ -axis.
In case of $x$ -axis (that is for plotting time): The car moves with uniform acceleration and attains a velocity of $25{\text{m/s}}$ in\[25{\text{ }}s\], so the first point is given as \[25{\text{ }}s\]. It then moves with uniform speed for$30s$, so the next point is given as $55\;{\text{s}}$ $(25 + 30 = 55s)$. Then the car is brought to rest in $20\;{\text{s}}$, so the last point is given as $75\;{\text{s}}$ $\left( {25 + 30 + 20 = 75\;{\text{s}}} \right)$.
Now, according to the formula for displacement, we have to calculate the Area under the velocity-time graph. (As Displacement= Area under velocity-time graph)
So we can clearly see in the figure that the figure forming in the velocity-time graph is a Trapezoid.
So,
\[ \Rightarrow {\text{Area of Trapezoid}} = \dfrac{1}{2} \times \left( {{\text{Sum of Parallel Sides}}} \right) \times \left( {{\text{Distance between them}}} \right)\]
Here, Parallel sides (according to the v-t graph) are \[AB\]and \[CD\]. And the distance between them is $25{\text{m/s}}$.
\[ \Rightarrow {\text{Area of Trapezoid}} = \dfrac{1}{2} \times \left( {AB + CD} \right) \times 25\]
Now, we substitute the given values as,
\[ \Rightarrow {\text{Area of Trapezoid}} = \dfrac{1}{2} \times (30 + 75) \times 25\]
After simplification we get,
\[ \Rightarrow {\text{Area of Trapezoid}} = 1312.5\;{\text{m}}\]
Hence, the total distance travelled using velocity-time graph is $1312.5\;{\text{m}}$.
Note: Mistakes occur while plotting the velocity-time graph. In $x$-axis, time plotted should be taken cautiously as the timestamps are summed up continuously and plotted. Conversion of units is done for the ease of calculation.
Recently Updated Pages
States of Matter Chapter For JEE Main Chemistry
Circuit Switching vs Packet Switching: Key Differences Explained
Mass vs Weight: Key Differences Explained for Students
[Awaiting the three content sources: Ask AI Response, Competitor 1 Content, and Competitor 2 Content. Please provide those to continue with the analysis and optimization.]
Sign up for JEE Main 2026 Live Classes - Vedantu
JEE Main 2026 Helpline Numbers - Center Contact, Phone Number, Address
Trending doubts
JEE Main 2026: Exam Dates, Session 2 Updates, City Slip, Admit Card & Latest News
JEE Main Participating Colleges 2026 - A Complete List of Top Colleges
Hybridisation in Chemistry – Concept, Types & Applications
Understanding the Electric Field of a Uniformly Charged Ring
Derivation of Equation of Trajectory Explained for Students
Understanding Atomic Structure for Beginners
Other Pages
JEE Advanced 2026 Notification Out with Exam Date, Registration (Extended), Syllabus and More
JEE Advanced Percentile vs Marks 2026: JEE Main Cutoff, AIR & IIT Admission Guide
CBSE Notes Class 11 Physics Chapter 1 - Units And Measurements - 2025-26
JEE Advanced 2026 Marks vs Rank: Estimate IIT Rank from Your Score
NCERT Solutions For Class 11 Physics Chapter 1 Units And Measurements - 2025-26
Important Questions For Class 11 Physics Chapter 1 Units and Measurement - 2025-26