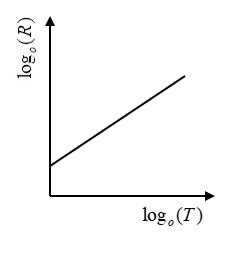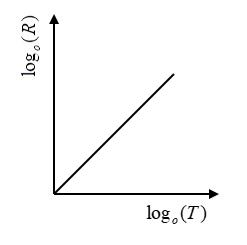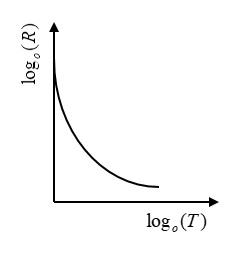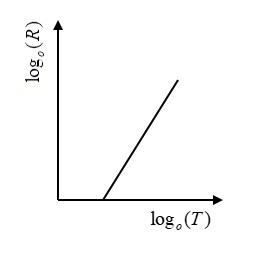
If an object at absolute temperature (T) radiates energy at rate $R$, then select the correct graph showing the variation of ${\log _0}R$ with ${\log _0}(T)$.
A)

B)

C)

D)

Answer
232.8k+ views
Hint: Rate of radiation of energy is known as power. We need to know the relation between rate of energy radiated and absolute temperature. Also understand what is meant by absolute temperature. Remember that absolute temperature and absolute zero temperature are related to each other but they are not the same.
Complete step by step solution:
When we start measuring temperature as $0K$ at the lowest possible energy state then temperature measured with respect to this zero is known as the absolute temperature of the object.
This measured $0K$ is known as the absolute zero temperature of the object.
Stefan-Boltzmann law gives us the relation between the power radiated and the absolute temperature of the object.
The law states that the power radiated by the object is directly proportional to the fourth power of the absolute temperature.
$P \propto {T^4}$
Mathematically, the equation is given as
$P = \varepsilon \sigma A{T^4}$
Where $P$ is the power radiated
$\varepsilon $ is the emissivity
$\sigma $ is the Stefan’s constant
$A$ is the radiating area
$T$ is the absolute temperature
Here in this question, the power radiated or the rate of energy radiated is represented as $R$ .
$ \Rightarrow R = \varepsilon \sigma A{T^4}$
Taking ${\log _0}$ on both sides of the equation, we get
$ \Rightarrow {\log _0}R = {\log _0}(\varepsilon \sigma A{T^4})$
$ \Rightarrow {\log _0}R = {\log _0}\varepsilon + {\log _0}\sigma + {\log _0}A + {\log _0}{T^4}$
$\because \varepsilon ,\sigma ,A$ are all constants ${\log _0}$ of all constants is also constant.
Therefore we can substitute ${\log _0}\varepsilon + {\log _0}\sigma + {\log _0}A = k$
$ \Rightarrow {\log _0}R = k + {\log _0}{T^4}$
We can represent this equation as a linear graph of ${\log _0}R$ VS ${\log _0}T$ with $k$ as the intercept.
Therefore, option $(A)$ is the correct graph where ${\log _0}R$ starts with an initial value of $k$ and then increases linearly with increase in the value of ${\log _0}T$ .
Note: Stefan’s constant $\sigma = 5.670 \times {10^8}watts/{m^2}{K^4}$ . It is the constant of proportionality in the Stefan-Boltzmann law. The emissivity $\varepsilon = 1$ for black body and $\varepsilon < 1$ for grey bodies. Stefan-Boltzmann law is used to calculate the temperature of the Sun.
Recently Updated Pages
JEE Main 2026 Session 2 Registration Open, Exam Dates, Syllabus & Eligibility

JEE Main 2023 April 6 Shift 1 Question Paper with Answer Key

JEE Main 2023 April 6 Shift 2 Question Paper with Answer Key

JEE Main 2023 (January 31 Evening Shift) Question Paper with Solutions [PDF]

JEE Main 2023 January 30 Shift 2 Question Paper with Answer Key

JEE Main 2023 January 25 Shift 1 Question Paper with Answer Key

Trending doubts
JEE Main Marking Scheme 2026- Paper-Wise Marks Distribution and Negative Marking Details

Understanding Average and RMS Value in Electrical Circuits

Understanding Collisions: Types and Examples for Students

Ideal and Non-Ideal Solutions Explained for Class 12 Chemistry

Understanding Atomic Structure for Beginners

Derive an expression for maximum speed of a car on class 11 physics JEE_Main

Other Pages
JEE Advanced Weightage 2025 Chapter-Wise for Physics, Maths and Chemistry

NCERT Solutions For Class 11 Physics Chapter 9 Mechanical Properties of Fluids (2025-26)

NCERT Solutions For Class 11 Physics Chapter 12 Kinetic Theory (2025-26)

NCERT Solutions For Class 11 Physics Chapter 4 Law of Motion (2025-26)

Class 11 JEE Main Physics Mock Test 2025

Inductive Effect and Its Role in Acidic Strength


