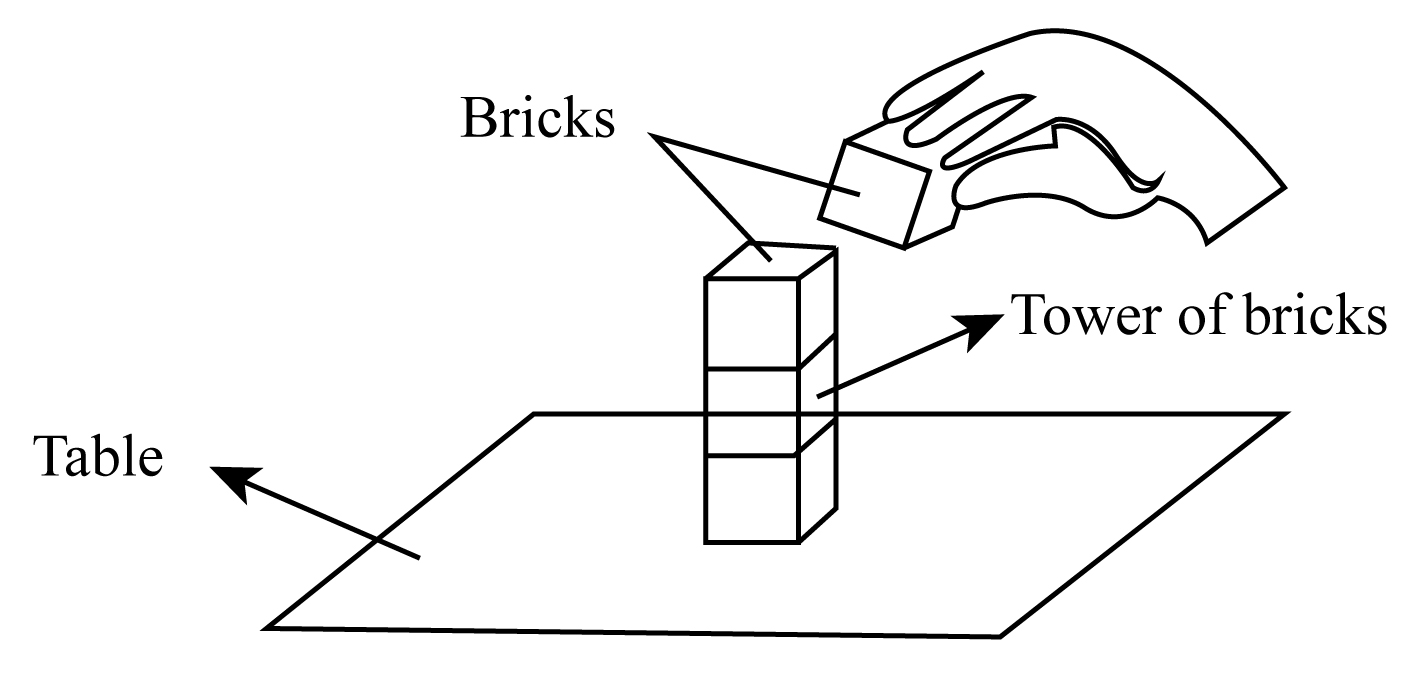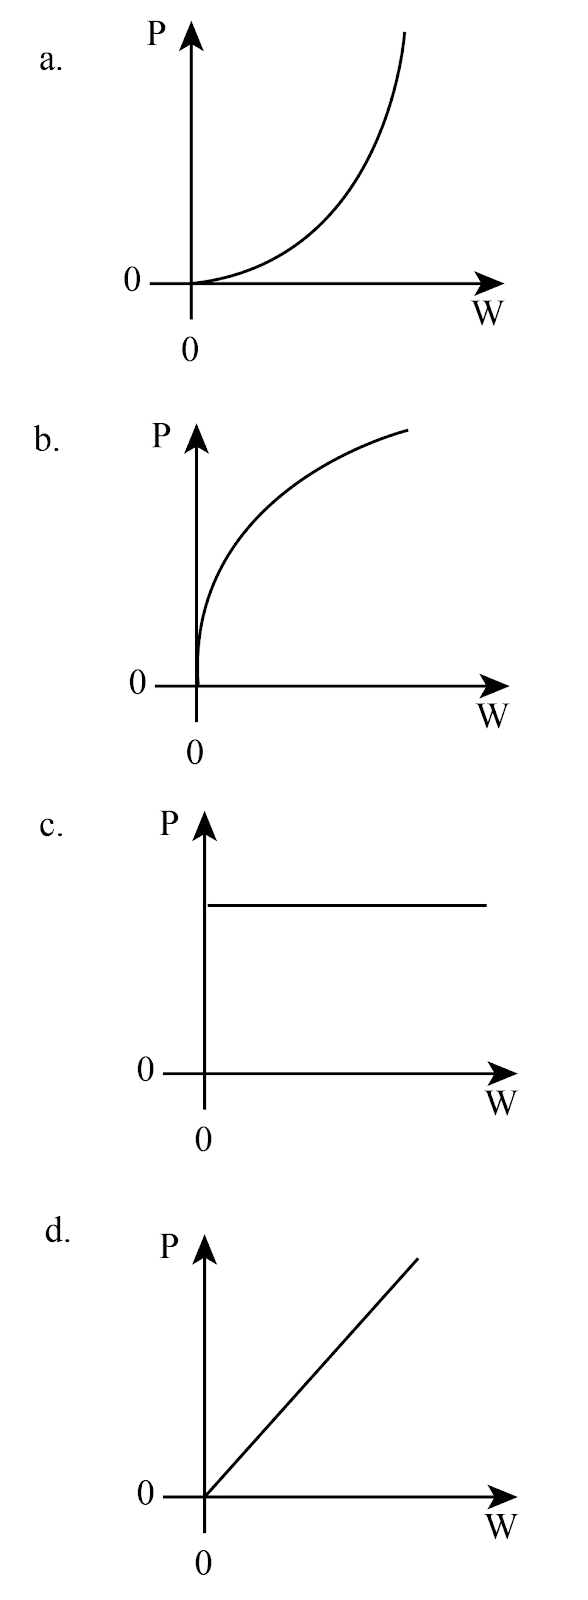
Identical toy bricks are placed one on top of another to make a tower on a table. Which graph shows the relationship between the pressure P that the tower exerts on the table and the weight W of the tower?


Answer
233.1k+ views
Hint: As we all know that force is just an effort applied at a point to move some object or body. But if the value of the same force is increased on that particular area then we can say that the intensity of force is increased and we need to define a new quantity and that is pressure.
Complete step by step answer:
We should keep in mind that pressure is the force applied on the unit area of the surface. Pressure can be represented as:
$P = \dfrac{W}{A}$ …… (I)
Here $P$ is the pressure, $W$ is the force applied and $A$ is the surface area. Therefore, we can see that pressure depends on force and surface area.
Pressure has the characteristics of proportionality factor. Area is something which gives us the direction and pressure is defined everywhere in the volume of the bulk and not just only at the surface. A gas inside the container has a pressure everywhere overall the bulk volume.
Now we can see that the slope of P vs W graph is,
$ \Rightarrow m = \dfrac{P}{W}$ ….. (II)
Here m is the slope.
Now from equation (I), we can write equation (II) as,
$ \Rightarrow m = \dfrac{P}{W} = \dfrac{1}{A} = C$
Here, now C is the constant since the surface area A is constant. Therefore, we can say that the graph would be having a linear positive slope.
Therefore, the correct option is (D).
Note: In this problem the bottom most toy brick feels the pressure due to the reaction(normal) from the surface and also from the upper toy bricks, these pressures act on the lower and upper surface of the toy brick respectively. But while solving this problem we have only considered pressure on the surface due to the entire toy brick system.
Recently Updated Pages
JEE Main 2023 April 6 Shift 1 Question Paper with Answer Key

JEE Main 2023 April 6 Shift 2 Question Paper with Answer Key

JEE Main 2023 (January 31 Evening Shift) Question Paper with Solutions [PDF]

JEE Main 2023 January 30 Shift 2 Question Paper with Answer Key

JEE Main 2023 January 25 Shift 1 Question Paper with Answer Key

JEE Main 2023 January 24 Shift 2 Question Paper with Answer Key

Trending doubts
JEE Main 2026: Session 2 Registration Open, City Intimation Slip, Exam Dates, Syllabus & Eligibility

JEE Main 2026 Application Login: Direct Link, Registration, Form Fill, and Steps

Understanding the Angle of Deviation in a Prism

Hybridisation in Chemistry – Concept, Types & Applications

How to Convert a Galvanometer into an Ammeter or Voltmeter

Understanding Uniform Acceleration in Physics

Other Pages
JEE Advanced Marks vs Ranks 2025: Understanding Category-wise Qualifying Marks and Previous Year Cut-offs

Laws of Motion Class 11 Physics Chapter 4 CBSE Notes - 2025-26

Waves Class 11 Physics Chapter 14 CBSE Notes - 2025-26

Mechanical Properties of Fluids Class 11 Physics Chapter 9 CBSE Notes - 2025-26

Thermodynamics Class 11 Physics Chapter 11 CBSE Notes - 2025-26

Units And Measurements Class 11 Physics Chapter 1 CBSE Notes - 2025-26


