


Draw the graphs showing variation of the photoelectric current with applied voltage for two incident radiations equal frequency and different intensities. Mark the graph for radiation of higher intensity.
Answer
268.5k+ views
Hint: In the process of photoelectric effect, the electrons from the metal surface are made to emit with the use of the light radiations which incident on it. These electrons are used as the current and it is known as photo electric current.
Complete step by step solution:
The radiation incident on the metal surface influences the output photo current of the metal. The suitable radiation produces the photo current which is directly proportional to the intensity of the radiation that incident on the surface of the metal. Intensity is defined as the power of the incident light that falls on the metal surface. The frequency is the number of times the repeated event occurs over a given time. The below graph represents the variation of the photocurrent of the two equal voltages with the same frequency but the different intensities.
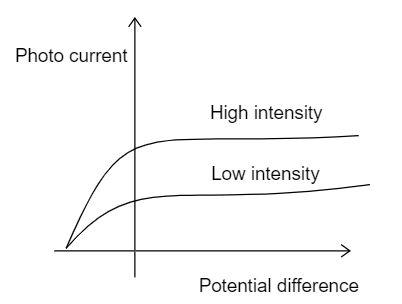
Hence the graph shows that the radiations of the same frequency but the different intensity may produce the different photocurrent from the metal. Hence the intensity of the radiation has the most influence in the production of the photocurrent.
Note: The point at which the photocurrent is maximum, it is called as the saturation current and point in which the photo current becomes zero, it is called as the cut- off voltage. The cut- off voltage is also called stopping potential.
Complete step by step solution:
The radiation incident on the metal surface influences the output photo current of the metal. The suitable radiation produces the photo current which is directly proportional to the intensity of the radiation that incident on the surface of the metal. Intensity is defined as the power of the incident light that falls on the metal surface. The frequency is the number of times the repeated event occurs over a given time. The below graph represents the variation of the photocurrent of the two equal voltages with the same frequency but the different intensities.
Hence the graph shows that the radiations of the same frequency but the different intensity may produce the different photocurrent from the metal. Hence the intensity of the radiation has the most influence in the production of the photocurrent.
Note: The point at which the photocurrent is maximum, it is called as the saturation current and point in which the photo current becomes zero, it is called as the cut- off voltage. The cut- off voltage is also called stopping potential.
Recently Updated Pages
Algebra Made Easy: Step-by-Step Guide for Students
JEE Isolation, Preparation and Properties of Non-metals Important Concepts and Tips for Exam Preparation
JEE Energetics Important Concepts and Tips for Exam Preparation
Chemical Properties of Hydrogen - Important Concepts for JEE Exam Preparation
JEE General Topics in Chemistry Important Concepts and Tips
JEE Amino Acids and Peptides Important Concepts and Tips for Exam Preparation
Trending doubts
JEE Main 2026: Exam Dates, Session 2 Updates, City Slip, Admit Card & Latest News
JEE Main Participating Colleges 2026 - A Complete List of Top Colleges
Kinematics Mock Test for JEE Main 2025-26: Comprehensive Practice
Understanding the Electric Field of a Uniformly Charged Ring
Derivation of Equation of Trajectory Explained for Students
Understanding Atomic Structure for Beginners
Other Pages
CBSE Class 12 Physics Question Paper 2026: Download SET-wise PDF with Answer Key & Analysis
JEE Advanced 2026 Notification Out with Exam Date, Registration (Extended), Syllabus and More
JEE Advanced Percentile vs Marks 2026: JEE Main Cutoff, AIR & IIT Admission Guide
JEE Advanced 2026 Marks vs Rank: Estimate IIT Rank from Your Score
JEE Advanced Weightage Chapter Wise 2026 for Physics, Chemistry, and Mathematics
JEE Main Marking Scheme 2026- Paper-Wise Marks Distribution and Negative Marking Details