


Draw the distance-time graph of a body moving with a constant speed of $5m/s$ for$10s$.
Answer
264.9k+ views
Hint: Speed may be a measure of how quickly an object moves from one place to another. It’s equal to the distance traveled divided by the time. It’s potential to search out any of those 3 values using the opposite two.
Formula used:
Speed,
$ \Rightarrow S = \dfrac{D}{T}$
Here, $S$ is the speed, $D$ is the distance, and $T$ is the time.
Complete step by step solution:
Here we have to plot the graph of the distance-time. And it is given that we are a body which is moving with constant speed and having some time which is given in the question.
Now we will calculate the distance the body covers. Since we have to plot the graph for the distance that’s why we have to first calculate the distance.
By using the above formula,
$ \Rightarrow S = \dfrac{D}{T}$
It can also be written as
$ \Rightarrow D = S \times T$
Now we will put the values.
On putting the values, we get
$ \Rightarrow D = 5m/s \times 10s$
On solving the above lines we will get,
$ \Rightarrow D = 50m/{s^2}$
Now for this, we will plot the graph.
So the distance-time graph for the constant speed is shown below, distance is changing with the constant speed and time. Hence the graph will be a straight line having the slope in it.
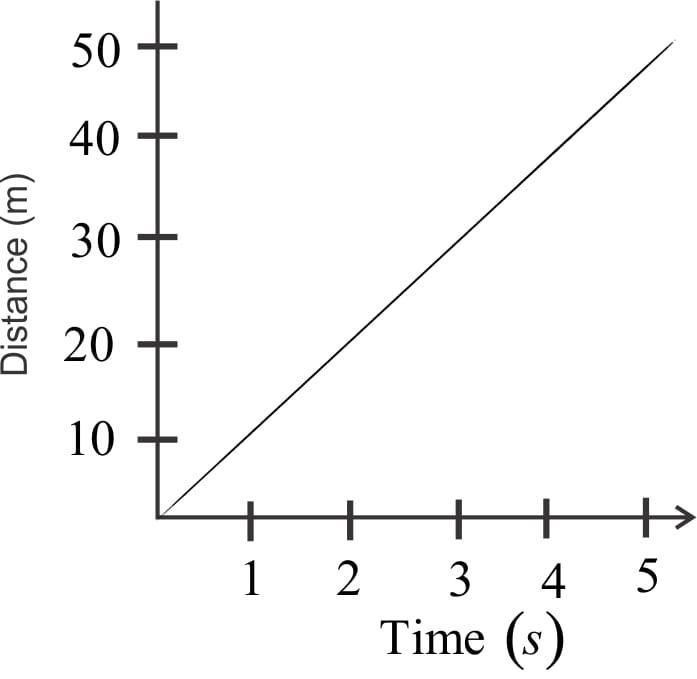
The above graph is the distance-time graph of a body which is moving with the constant speed of $5m/s$ and having the time is $10s$.
Note: If an object moves on a line, the distance traveled is described by a distance-time graph. In a distance-time graph, the gradient of the road is up to the speed of the object. The bigger the gradient (and the steeper the line) the quicker the thing is moving.
Formula used:
Speed,
$ \Rightarrow S = \dfrac{D}{T}$
Here, $S$ is the speed, $D$ is the distance, and $T$ is the time.
Complete step by step solution:
Here we have to plot the graph of the distance-time. And it is given that we are a body which is moving with constant speed and having some time which is given in the question.
Now we will calculate the distance the body covers. Since we have to plot the graph for the distance that’s why we have to first calculate the distance.
By using the above formula,
$ \Rightarrow S = \dfrac{D}{T}$
It can also be written as
$ \Rightarrow D = S \times T$
Now we will put the values.
On putting the values, we get
$ \Rightarrow D = 5m/s \times 10s$
On solving the above lines we will get,
$ \Rightarrow D = 50m/{s^2}$
Now for this, we will plot the graph.
So the distance-time graph for the constant speed is shown below, distance is changing with the constant speed and time. Hence the graph will be a straight line having the slope in it.
The above graph is the distance-time graph of a body which is moving with the constant speed of $5m/s$ and having the time is $10s$.
Note: If an object moves on a line, the distance traveled is described by a distance-time graph. In a distance-time graph, the gradient of the road is up to the speed of the object. The bigger the gradient (and the steeper the line) the quicker the thing is moving.
Recently Updated Pages
JEE Main Mock Test 2025-26: Principles Related To Practical
JEE Main 2025-26 Experimental Skills Mock Test – Free Practice
JEE Main 2025-26 Electronic Devices Mock Test: Free Practice Online
JEE Main 2025-26 Mock Tests: Free Practice Papers & Solutions
JEE Main 2025-26: Magnetic Effects of Current & Magnetism Mock Test
JEE Main Statistics and Probability Mock Test 2025-26
Trending doubts
JEE Main 2026: Exam Dates, Session 2 Updates, City Slip, Admit Card & Latest News
JEE Main Participating Colleges 2026 - A Complete List of Top Colleges
Hybridisation in Chemistry – Concept, Types & Applications
Understanding the Electric Field of a Uniformly Charged Ring
Derivation of Equation of Trajectory Explained for Students
How to Convert a Galvanometer into an Ammeter or Voltmeter
Other Pages
JEE Advanced 2026 Notification Out with Exam Date, Registration (Extended), Syllabus and More
JEE Advanced Percentile vs Marks 2026: JEE Main Cutoff, AIR & IIT Admission Guide
CBSE Notes Class 11 Physics Chapter 1 - Units And Measurements - 2025-26
NCERT Solutions For Class 11 Physics Chapter 1 Units And Measurements - 2025-26
Important Questions For Class 11 Physics Chapter 1 Units and Measurement - 2025-26
JEE Advanced Weightage Chapter Wise 2026 for Physics, Chemistry, and Mathematics