


An Introduction to Gini Index
The Gini index measures the income distribution of the population. This index is also known as the Gini coefficient, which was developed by the Italian statistician Corrado Gini in 1912. It often serves as a measure of economic inequality, measuring income distribution or wealth distribution among the population. Keep reading through the entire article to know more about Gini index and its measures.
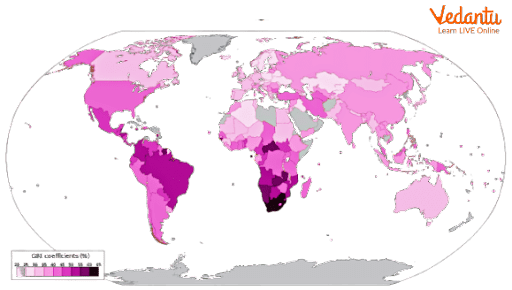
The Gini Coefficient of Different Countries
Indices of Income Distribution Measure
Income distribution describes how a country’s total GDP is distributed among its population. Using the Gini coefficient, many organisations measure income inequality by country. The Gini index is an accurate and reliable index for measuring the income distribution of a country.
The Gini index measurements are between 0 to 1. 1 indicates perfect inequality while 0 indicates perfect equality.
The Gini Index Measures
The Gini index measures the extent to which the distribution of income or consumption among individuals within an economy deviates from perfectly equal distribution. The Gini index is represented graphically through the Lorenz curve, which shows income distribution.

The Gini Coefficient
The Measure of Dispersion Afford
The measures of dispersion give us a single value indicating the degree of consistency of distribution. The following are the three commonly used measures of dispersion.
Range: It’s the difference between the largest and the smallest number in the data. This measure of dispersion is straightforward to calculate.
Interquartile Range: This is defined as the difference between the 25th and 75th percentile. This measure of dispersion can be used as a measure of variability if the extreme values are not being recorded.
Standard Deviation: This is the most commonly used measure. It also measures variation within the data.
Inequality Indicators
Inequalities refer to the disparities in incomes and wealth in a society. The following are some indicators:
Gini Coefficient: This is the most popular measure of income inequality. This coefficient is obtained from the Lorenz curve. This curve shows the percentage of total income earned by the cumulative percentage of the population.

The Gini Coefficient Formula
Atkinson Index: This index allows for varying sensitivity to inequalities in different parts of the income distribution. According to this index, measures such as the Gini coefficient are not purely statistical.
Coefficient of Variation: This measure of income equality is calculated by dividing the standard deviation of the income distribution by its mean.
Decline Ratios: It is a simple way to examine inequality. These ratios can be calculated, for example, by the income earned by the top 10% of households and dividing that by the income earned by the poorest 10% of the households.
Case Study
The following is the Gini coefficient of various countries:
Analyse the Gini coefficient of various countries.
Ans: The nearer the country's Gini coefficient is to 1, the more serious a country’s economic inequality. A higher gini coefficient indicates:
The government’s policies favour the rich more than the poor and are not inclusive enough.
A higher ratio may encourage the government to spend more on social welfare programs.
It will also increase the tax burden on the rich.
Conclusion
In a nutshell, the Gini index is the most important tool which measures income distribution. The higher the Gini coefficient, the wider the gap between the incomes of a country’s richest and poorest people. This ratio is important because it identifies levels of income inequality which can have many undesirable political and economic impacts. The Gini coefficient can be applied in the field of science also. It can also be used in education as a measure of the inequality of schools and colleges.
FAQs on Gini Index
1. What is the Gini Index and what does it measure?
The Gini Index, also known as the Gini coefficient or Gini ratio, is a statistical measure used to represent income or wealth inequality within a population. It quantifies how evenly a resource is distributed, with a value ranging from 0 to 1 (or 0% to 100%). A Gini Index of 0 signifies perfect equality (where everyone has the same income), while a value of 1 signifies perfect inequality (where one individual holds all the income).
2. How is the Gini Index calculated conceptually using the Lorenz Curve?
The Gini Index is visually and conceptually derived from the Lorenz Curve. The calculation involves comparing the Lorenz Curve (which plots the actual distribution of income) to the line of perfect equality (a 45-degree straight line). The Gini Index is the ratio of the area between the line of perfect equality and the Lorenz Curve to the total area under the line of perfect equality. A larger area between the curves indicates greater inequality and a higher Gini Index.
3. What is the importance of the Gini Index for economic analysis?
The Gini Index is a vital tool for economists and policymakers for several reasons. Its importance lies in its ability to:
- Provide a concise summary of the level of income or wealth disparity in a country.
- Allow for the comparison of inequality levels across different countries or regions.
- Track changes in income distribution over time, helping to assess the impact of economic policies and growth.
- Inform government decisions on social welfare programs and tax structures aimed at reducing inequality.
4. What are the primary limitations of using the Gini Index?
While useful, the Gini Index has several limitations.
- Different distributions, same index: Countries with very different income distribution patterns can have the same Gini coefficient.
- Data accuracy: Its validity is highly dependent on the quality and reliability of the income or wealth data collected, which can be prone to errors.
- Ignores demographics: It does not account for structural changes in a population, such as an ageing workforce or varying household sizes, which can influence inequality.
- Lacks absolute context: It measures relative inequality but provides no information about the absolute income levels or the overall wealth of a country. A low-income country and a high-income country could have the same Gini Index.
5. Can two countries with different income distributions have the same Gini Index? Explain how.
Yes, it is possible for two countries with different income distributions to have the same Gini Index. This is a key conceptual limitation of the measure. The Gini Index summarises the entire Lorenz Curve into a single number representing the area of inequality. It is possible for two differently shaped Lorenz curves to enclose the exact same area. For example, one country's inequality might stem from a gap between the middle class and the rich, while another's might be due to a gap between the poor and the middle class. If the total deviation from perfect equality is the same, their Gini coefficients will be identical, hiding the underlying structural differences.
6. How does the Gini Index relate to the Lorenz Curve?
The Gini Index and the Lorenz Curve are intrinsically linked. The Lorenz Curve is a graphical representation of wealth or income distribution. The Gini Index is the numerical representation of the information shown on the Lorenz Curve. Specifically, the Gini Index quantifies the degree to which the Lorenz Curve deviates from the line of perfect equality. The further the Lorenz Curve is from this line, the larger the area of inequality, and the higher the Gini Index.
7. What is the practical application of the Gini Index for a country like India?
For a large and diverse economy like India, the Gini Index serves as a critical indicator for policymakers. Its practical applications include:
- Policy Formulation: It helps in designing and evaluating targeted welfare schemes and tax policies aimed at reducing the income gap between the rich and the poor.
- Assessing Economic Growth: It is used to monitor whether the benefits of economic growth are being distributed equitably or are concentrated among a small section of the population.
- Regional Analysis: The index can be used to compare income disparities between different states and urban vs. rural areas, guiding regional development strategies and resource allocation.