


What Is the Equation of Y Axis and Why Is It x Equals Zero
To understand the equation of the y-axis. First, we have to understand graphs. What is a graph? A graph consists of a horizontal line and a vertical line, called the horizontal axis and the vertical axis, respectively. Why do we use a graph? A graph is used to represent data. A point can be determined horizontally or vertically, which can be easily understood using a graph. The horizontal axis is called the x-axis and the vertical axis is called the y-axis in a graph. Let us proceed further to know more about this topic.
More about Graphs and X and Y-axis
To represent a point on a graph we take given points on the x-axis and y-axis respectively as (x,y). The (0,0) coordinate is called origin, where the x-axis and the y-axis meet. We take positive points at the x-axis and negative points at the x’-axis. Similarly, we take positive points at the y-axis and negative points at the y’-axis.
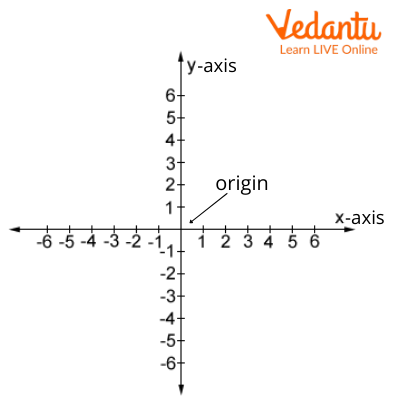
A Graph
What Is the Equation of the Y-axis?
Let us have an equation y = 2x + 3. To represent it, we will make a table.
Here we have values for both y and the x-axis. So, what is the equation of the y-axis?
When all the values of the equation lie on the y-axis, the values of x come 0 for all values of y, it is called the equation of the y-axis. So, the equation of y-axis is
x = 0
Let understand it with an example, x = 0*y
For y = 3, x will be 0
Y = -3, x will be 0
Similarly, for all value of y, x is 0.
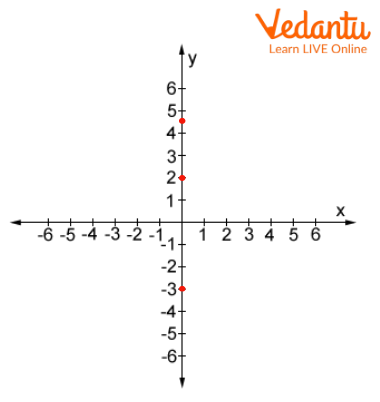
Graph of the Equation of Y-axis
Line Parallel to Y-axis
A line is said to parallel to the y-axis when it is drawn along the y-axis, hence perpendicular to the x-axis, where the value of x remains constant for all values of y.
The common equation of the line parallel to the y-axis is
x= by + c, where b is 0
So, the equation of the line parallel to the y-axis is x = c. Here c is a constant.
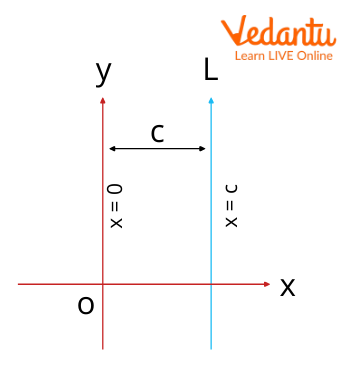
Graph of a Line Parallel to Y-axis
When b is 0, for all values of y, the value of x comes constant c. Let's understand it with an example.
x= (0)y + 2
A Line parallel to the Y-axis
Let’s Write the Equations of the Y-axis and X-axis
From the above discussion, we know the equation of the y-axis is x=0.
Similarly, the equation of the x-axis is y=0.
Here the point lies on the x-axis therefore for all values of x, y becomes 0. So, the equation of the y-axis is given by
x = 0
And the equation of the x-axis is given by
y = 0
Questions for Practice
Draw the points (0,2), (0,4), and (0,-7)on a coordinate system. Do all the points lie on the same line? Can you name the line
(Answer. y-axis)
Draw the points (2,0), (6,0), and (-3,0) on a coordinate system. Do all the points lie on the same line? Can you name the line?
(Answer: x-axis)
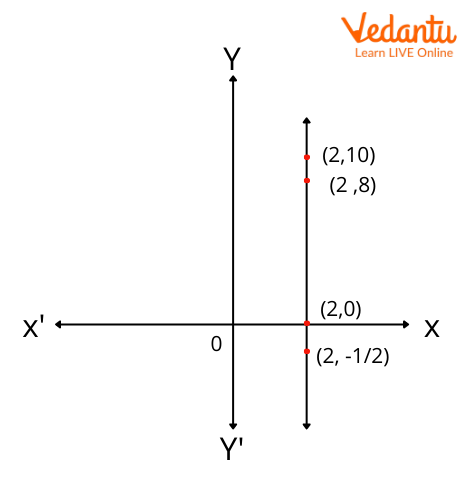
Draw the points (3,2), (3,4.5), and (3,-3) on a coordinate system. Do all the points lie on the same line? Can you name the line?
(Answer: yes, a line parallel to the y-axis)
Draw the points (2,2), (0,2), and (6,2) on a coordinate system. Do all the points lie on the same line? Can you name the line?
(Answer: y a line parallel to the x-axis)
Summary
We have learned the coordinates of the graph. The coordinate is written as (x,y).We have learned the equation of the y-axis. The equation is x = 0. We have learned the equation of the x-axis. The equation is y = 0. We have learned the equation of line parallel to the y-axis. The equation of the line parallel to the y-axis is x = c.
FAQs on Equation of the Y Axis in Coordinate Geometry
1. What is the equation of the y-axis?
The equation of the y-axis is x = 0. This is because every point on the y-axis has an x-coordinate equal to zero, while the y-coordinate can be any real number. For example, points like (0, 2), (0, −5), and (0, 0) all lie on the y-axis.
2. Why is the equation of the y-axis written as x = 0?
The equation is written as x = 0 because the x-coordinate of every point on the y-axis is zero. In the Cartesian coordinate system:
- The x-coordinate measures horizontal distance.
- The y-axis is the vertical line where horizontal distance is zero.
3. How do you derive the equation of the y-axis?
The equation of the y-axis is derived by observing that all its points have x-coordinate equal to 0. Steps:
- Consider any point on the y-axis.
- Its horizontal distance from the origin is zero.
- Therefore, its x-value is 0.
4. Is the equation of the y-axis a linear equation?
Yes, x = 0 is a linear equation representing a vertical straight line. Although it cannot be written in the slope-intercept form (y = mx + c), it is still a first-degree equation in x and represents a straight line parallel to the y-direction.
5. What is the slope of the y-axis?
The slope of the y-axis is undefined. Since the y-axis is a vertical line, the change in x is zero, and slope = rise/run becomes division by zero, which is not defined.
6. What is the difference between the equation of the x-axis and the y-axis?
The equation of the x-axis is y = 0, while the equation of the y-axis is x = 0. Key differences:
- x-axis is horizontal; y-axis is vertical.
- On the x-axis, y-coordinate is always 0.
- On the y-axis, x-coordinate is always 0.
7. Can you give examples of points that lie on the y-axis?
Any point with x-coordinate equal to 0 lies on the y-axis. Examples include:
- (0, 3)
- (0, −7)
- (0, 0)
8. Does the equation x = 0 represent a function?
No, x = 0 does not represent a function of y in the form y = f(x). A vertical line like the y-axis fails the vertical line test because one x-value (0) corresponds to infinitely many y-values.
9. What is the intercept of the y-axis?
The y-axis intersects both axes at the origin (0, 0). This point is called the origin and is the only point common to both the x-axis and y-axis.
10. How is the equation of the y-axis used in coordinate geometry?
The equation x = 0 is used to identify vertical reference lines and symmetry in coordinate geometry. Common uses include:
- Checking if a point lies on the y-axis.
- Finding symmetry of graphs about the y-axis.
- Solving problems involving reflections across the y-axis.