


Consider the following statement.
I. Mode can be computed from histogram.
II. Median is not independent of change of scale.
III. Variance independent of change of origin and scale.
Which of these is/are correct?
A. Only I
B. Only II
C. I and II
D. I, II, and II
Answer
260.1k+ views
Hint: First we will draw a histogram to check whether the mode can be found in the histogram. Next from the formula of the median, we will decide whether the second statement is true or not. Similarly, from the formula of the variance, we will decide whether the second statement is true or not.
Formula Used:
The formula for median is $ = l + \dfrac{h}{f}\left( {\dfrac{N}{2} - C} \right)$
The formula of variance is ${\sigma ^2} = \dfrac{{\sum\limits_{i = 1}^N {\left( {{x_i} - \mu } \right)} }}{N}$
Complete step by step solution:
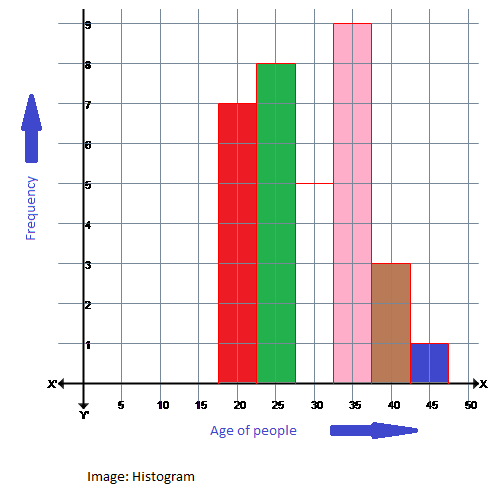
Let's consider the above histogram.
The value that appears most frequently in a data set is called the mode.
From the histogram, we can say that the frequency of the people whose age is 35 is maximum.
So, 35 is the mode of data.
Thus, statement I is correct.
The formula of median is $ = l + \dfrac{h}{f}\left( {\dfrac{N}{2} - C} \right)$
$l \to $ Lower class boundary of median class
$h \to $ Size of the median class interval
$f \to $ Frequency corresponding to median class
$N \to $ Total number of observations
$C \to $ Cumulative frequency preceding median class
The median of a data will be changed if data are changed. Hence the median of data is dependent on the change of scale.
Hence statement II is correct.
The formula of variance is ${\sigma ^2} = \dfrac{{\sum\limits_{i = 1}^N {\left( {{x_i} - \mu } \right)} }}{N}$
${\sigma ^2} \to $ Population variance.
${x_i} \to $ Value of ${i^{th}}$ element.
$\mu \to $ Population mean.
$N \to $ Population size.
The variance of a data will be changed if data are changed. Hence the variance of data is dependent on the change of scale.
Hence statement III is incorrect.
Option ‘C’ is correct
Note: Here Change of scale means the changes of data. An extension of the bar graph is the histogram. A histogram is a type of vertical bar graph in which the bars represent grouped continuous data. The shape of a histogram can tell you a lot about the distribution of the data, as well as provide you with information about the mean, median, and mode of the data set. Students must remember the basic definition related to statistics in order to visualize the mean, median, mode directly from histogram.
Formula Used:
The formula for median is $ = l + \dfrac{h}{f}\left( {\dfrac{N}{2} - C} \right)$
The formula of variance is ${\sigma ^2} = \dfrac{{\sum\limits_{i = 1}^N {\left( {{x_i} - \mu } \right)} }}{N}$
Complete step by step solution:
Let's consider the above histogram.
The value that appears most frequently in a data set is called the mode.
From the histogram, we can say that the frequency of the people whose age is 35 is maximum.
So, 35 is the mode of data.
Thus, statement I is correct.
The formula of median is $ = l + \dfrac{h}{f}\left( {\dfrac{N}{2} - C} \right)$
$l \to $ Lower class boundary of median class
$h \to $ Size of the median class interval
$f \to $ Frequency corresponding to median class
$N \to $ Total number of observations
$C \to $ Cumulative frequency preceding median class
The median of a data will be changed if data are changed. Hence the median of data is dependent on the change of scale.
Hence statement II is correct.
The formula of variance is ${\sigma ^2} = \dfrac{{\sum\limits_{i = 1}^N {\left( {{x_i} - \mu } \right)} }}{N}$
${\sigma ^2} \to $ Population variance.
${x_i} \to $ Value of ${i^{th}}$ element.
$\mu \to $ Population mean.
$N \to $ Population size.
The variance of a data will be changed if data are changed. Hence the variance of data is dependent on the change of scale.
Hence statement III is incorrect.
Option ‘C’ is correct
Note: Here Change of scale means the changes of data. An extension of the bar graph is the histogram. A histogram is a type of vertical bar graph in which the bars represent grouped continuous data. The shape of a histogram can tell you a lot about the distribution of the data, as well as provide you with information about the mean, median, and mode of the data set. Students must remember the basic definition related to statistics in order to visualize the mean, median, mode directly from histogram.
Recently Updated Pages
Area vs Volume: Key Differences Explained for Students
Mutually Exclusive vs Independent Events: Key Differences Explained
JEE Main 2024 (January 25 Shift 1) Chemistry Question Paper with Solutions [PDF]
Differential Calculus: Concepts, Rules & Applications Explained
Torque and Rotational Motion Explained: Physics Made Simple
Second Law of Thermodynamics Explained: Simple Guide for Students
Trending doubts
JEE Main Marks vs Percentile 2026: Predict Your Score Easily
JEE Main Cutoff 2026: Category-wise Qualifying Percentile
JEE Main 2026: Exam Dates, Session 2 Updates, City Slip, Admit Card & Latest News
JEE Main 2026 Session 2 Result Out Live Scorecard Link Active Cutoff Released
JEE Main Marks vs Rank 2026: Expected Rank for 300 to 0 Marks
NIT Cutoff 2026: Tier-Wise Opening and Closing Ranks for B.Tech. Admission
Other Pages
CBSE Class 10 Maths Question Paper 2026 OUT Download PDF with Solutions
Complete List of Class 10 Maths Formulas (Chapterwise)
NCERT Solutions For Class 10 Maths Chapter 11 Areas Related To Circles - 2025-26
All Mensuration Formulas with Examples and Quick Revision
NCERT Solutions For Class 10 Maths Chapter 13 Statistics - 2025-26
NCERT Solutions For Class 10 Maths Chapter 14 Probability - 2025-26