


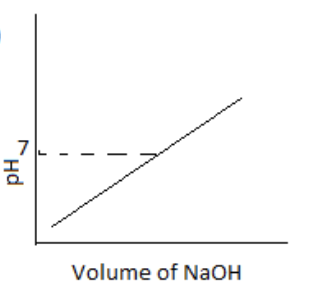
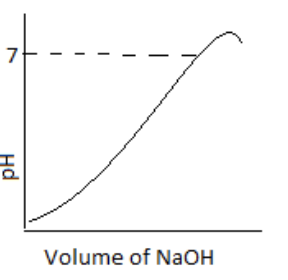
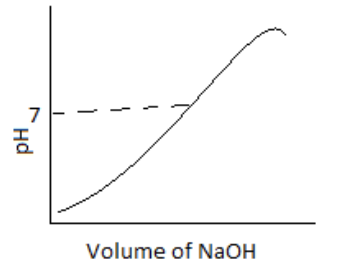
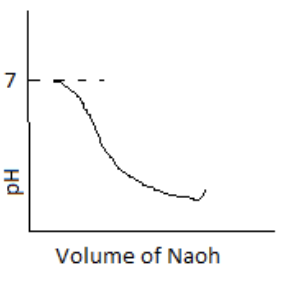
100 mL of 0.1 M HCl is taken in a beaker and to it, 100 mL OF 0.1 M NaOH is added in steps of 2mL and the pH is continuously measured. Which of the following graphs correctly depicts the change in pH?
(A)
(B)
(C)
(D)
Answer
233.1k+ views
Hint: The pH determines the percentage of Hydrogen in a solution. The formula to calculate pH is \[{\rm{pH}} = - {\rm{log}}\left[ {{{\rm{H}}^{\rm{ + }}}} \right]\].
Complete Step by Step Solution:
Now, we will discuss the pH scale. This scale contains values from 0 to 14. The pH values<7 indicates the acidity of the solution, the pH value of 7 indicates a neutral solution and the pH value >17 indicates the basicity of the solution.
Here, at first, 100 mL HCl of 0.1 M is taken. At that time, the pH of the solution is less than 7, which means the solution is acidic. After that, the addition of NaOH to the acid solution occurs. That reduces the acidity of the solution. And a point comes when the solution becomes neutral, neither acidic nor basic. After that, further addition of NaOH causes an increase in the basicity of the solution.
Here, the graph in option (3) represents the correct change of pH on adding NaOH to the HCl. At the starting point, it shows the acidity of the solution. The point of pH 7 indicates the equivalence point. And after that, an increase in pH indicates the increase in the basicity of the solution.
Hence, option (c) is right.
Note: In titration, a solution (concentration is known) is mixed to a solution (unknown concentration) till the reaction reaches neutralisation. And this is indicated by the change of colour of the solution.
Recently Updated Pages
JEE Main 2023 April 6 Shift 1 Question Paper with Answer Key
JEE Main 2023 April 6 Shift 2 Question Paper with Answer Key
JEE Main 2023 (January 31 Evening Shift) Question Paper with Solutions [PDF]
JEE Main 2023 January 30 Shift 2 Question Paper with Answer Key
JEE Main 2023 January 25 Shift 1 Question Paper with Answer Key
JEE Main 2023 January 24 Shift 2 Question Paper with Answer Key
Trending doubts
JEE Main 2026: Session 2 Registration Open, City Intimation Slip, Exam Dates, Syllabus & Eligibility
JEE Main 2026 Application Login: Direct Link, Registration, Form Fill, and Steps
JEE Main Marking Scheme 2026- Paper-Wise Marks Distribution and Negative Marking Details
Understanding the Angle of Deviation in a Prism
Hybridisation in Chemistry – Concept, Types & Applications
How to Convert a Galvanometer into an Ammeter or Voltmeter
Other Pages
JEE Advanced Marks vs Ranks 2025: Understanding Category-wise Qualifying Marks and Previous Year Cut-offs
NCERT Solutions For Class 12 Chemistry Chapter 1 Solutions (2025-26)
Solutions Class 12 Chemistry Chapter 1 CBSE Notes - 2025-26
NCERT Solutions For Class 12 Chemistry Chapter 4 The d and f Block Elements (2025-26)
Biomolecules Class 12 Chemistry Chapter 10 CBSE Notes - 2025-26
NCERT Solutions For Class 12 Chemistry Chapter 10 Biomolecules (2025-26)