


What is Charles Law?
Before you get to know about the graphical representation of Charles law, it will be better for you to have a piece of knowledge about this law. This is an important gas law that creates a relation between temperature and volume at a constant pressure. The law says the gas volume will increase when the temperature increases at a constant pressure.
It is also called the Law of Volumes. Jacques Charles, a well-known French scientist, introduced this law in 1787. However, Joseph Gay-Lussac added pressure and temperature relation at constant temperature to his concept in 1802, but the principle remains the same.
Temperature Vs Volume Graph
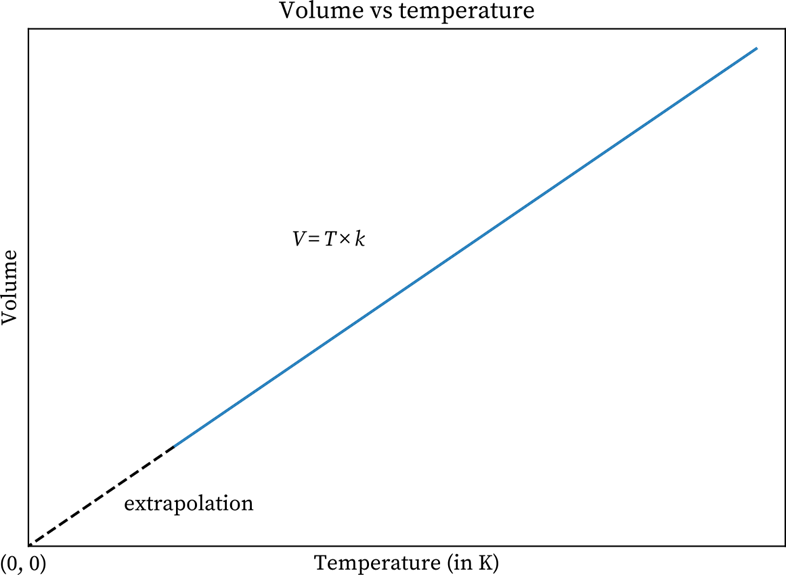
The graphs on Charles law, which is a volume-temperature graph, explain how at constant pressure, the volume of a gas mass is a linear function of temperature. The graph mentioned here demonstrates a constant pressure for a gas. If you look closely, you can see that with an increase in the current temperature, the volume also increases and vice versa. So, it can be said that volume is proportional to temperature.
Mathematical Explanation of Charles Law
An increase in the temperature makes the gas molecules move faster. While moving, the molecules hit the container’s walls with a greater force. This increases the pressure. But when the volume of the container increases, that will lower the number of strikes on the walls. The volume is on the y- axis, and you can find the temperature on the x-axis.
Volume v/s Temperature Graph
On the other hand, the graph has a positive slope. Here, the V is the gas volume, and T stands for Temperature. Now, as per Charles Law, the equation is:
$\dfrac {V_i}{V_f} = \dfrac {T_i}{T_f}$
The above graphical representation of Charles law clearly demonstrates with a rise in temperature, the volume also expands. The volume decreases when the temperature goes down. As per the experts, this law can be utilised to compare two different conditions or states of a gas. For example, if gas at a certain temperature T1 has volume V1. It contracts and expands in such a way that its final temperature and volume are T1 and V1. The formula here will be
${{V}_{1}}=k{{T}_{1}}$ and ${{V}_{2}}=k{{T}_{2}}$
Where k is the proportionality constant.
Then, you will need to divide one by the other.
$\dfrac{{{V}_{1}}}{{{T}_{1}}}=\dfrac{{{V}_{2}}}{{{T}_{2}}}$
Using the above equation, you will be able to understand the relationship between the final and initial conditions of the gas.
Graph in Celsius Scale

Graph in Celsius Scale
In the graph, the axis of the temperature is on the Kelvin scale. However, it is possible to demonstrate the Charles law diagram with the temperature in Celsius.
The equation here is:
${{\rm{V}}_{\rm{t}}}{\rm{ = }}{{\rm{V}}_{\rm{0}}}{\rm{ + }}\dfrac{{{{\rm{V}}_{\rm{0}}}{\rm{ \times t}}}}{{{\rm{273.15}}}}$
V stands for the volume, t means the temperature on the Celsius scale, and V means volume at t.
Based on the above formula, when the temperature reaches $-{{273.15}^{\circ }}C$, the volume also becomes zero. The equation for this is:
$\lim_{T \rightarrow -273.15}V=\lim_{T \rightarrow -273.15}(\dfrac{V_\circ }{273.15})t+V_\circ \\=(\dfrac{V_\circ }{273.15})(-273.15)+V_\circ \\=0$
Graphs of Charles Law at Different Pressures
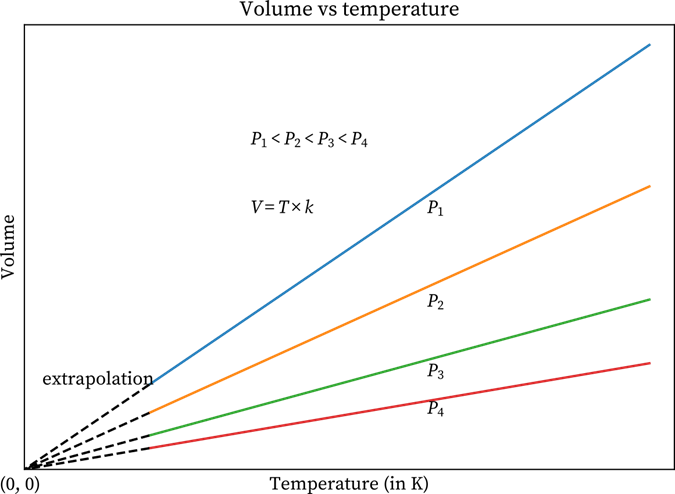
Well, the above-mentioned plots can also be plotted at various pressures. Have a look at the below-given graphs that have four different lines. The pressure level of each line is constant. The lines that are made at constant pressure are known as Isobars.
Temperature v/s Volume Graph at Four Different Pressures
All the lines converge at zero volume. The reason is that the temperature is zero. If you study carefully, you will find that when the pressure increases, the lines move inwards or toward the x-axis as when pressure increases, the value of k goes down.
Real-Life Example of Charles Law
After analysing different graphs on Charles law, it will be easier for you to come up with a real-life example of this law. Well, one of the most common examples is a floating hot air balloon. When the torch heats the air, the air particles start moving faster and then disperse. This process makes the air located inside the balloon less dense, and it makes the balloon float. Another example is baking bread or opening a soda can.
A pool tube can shrink or inflate. During winters, the water temperature will be near freezing. As a result, the tube’s air temperature will be low, and the tube will shrink. On the other hand, on a hot day, air will heat, and that raises the temperature, making the tube inflated.
What Do You Mean by Absolute Zero Temperature?
As volume is directly proportional to the Kelvin temperature, it will be theoretically zero at zero Kelvin, or you can say at -273-degree C. Well, this is completely hypothetical as the environment’s molecule has different physical properties to create liquid and then turn into solid before the gas reaches a lower temperature. However, the fact is, there are no such substances available in gases at such temperatures near zero. If you want to carry out the liquefaction of natural gases, you will have to maintain a critical temperature.
Conclusion
The graph representing Charles law can help you to clearly understand a formal relationship between volume and temperature. This is a popular experimental gas law and states that the volume covered by a gas at a particular pressure is proportional to its current temperature. However, there is a limitation of this law. It may be noted that the graphs of Charles Law can only be used for ideal gases.
FAQs on Graphs on Charles Law for JEE
1. Which equation demonstrates Charles law?
A simple meaning of the Charles law formula is when the pressure level on a dry gas remains constant, the volume, along with the Kelvin temperature, will be in a direct proportion. The equation that can be used here will be PV=K. You can learn more about this by looking at the graph of Charles law. The K may remain constant here. The letter P stands for the total amount of pressure, and V denotes Volume. That’s why V=KT. When the temperature increases, the gas volume will also go up accordingly.
2. Why is Charles Law so important?
Charles Law, also known as the law of volumes, will give you a detailed explanation of when you increase the temperature, the gas expands. Conversely, when the temperature decreases, it leads to a decrease in the overall volume. The application of Charles law can be witnessed in your kitchen. For example, making cake and bread. Yeast generates carbon dioxide, and when you bake your bread at a higher temperature, with a rise in temperature, carbon dioxide will begin to expand.