


ICSE Class 10 Mathematics Chapter 23 Selina Concise Solutions - Free PDF Download
Exercise 23(A)
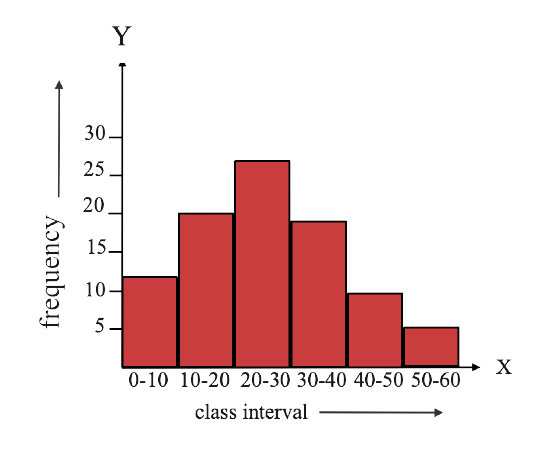
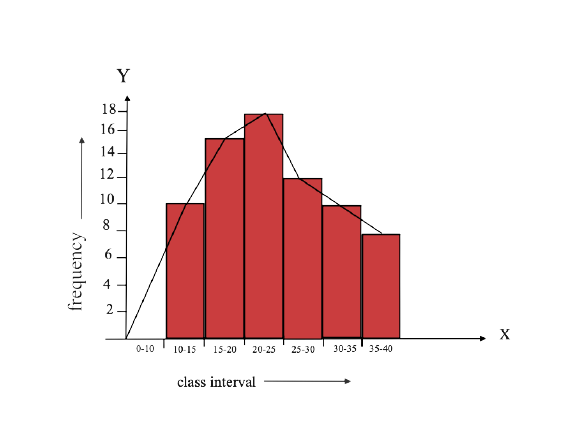
1. Draw a histograms for the following frequency distributions:
(i)
Ans: Steps of Construction:
Using appropriate scales, mark class intervals on the x-axis and frequency on the y-axis.
Draw rectangles with class intervals as bases and frequencies as heights.
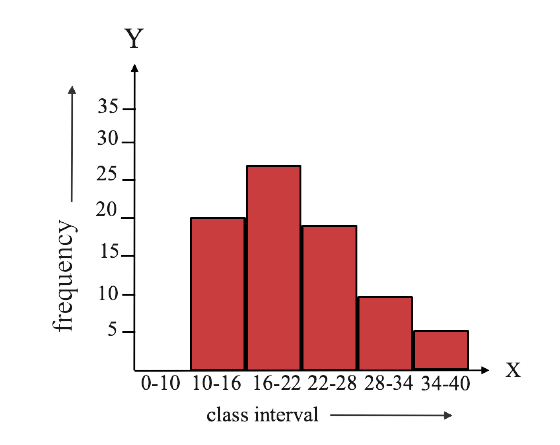
(ii)
Ans: Steps of Construction:
Using appropriate scales, mark class intervals on the x-axis and frequency on the y-axis.
Draw rectangles with class intervals as bases and frequencies as heights.
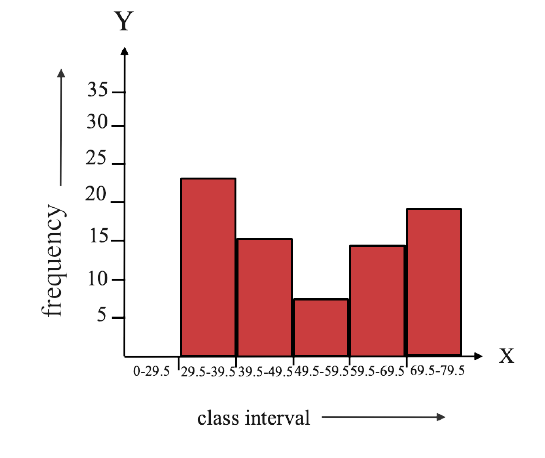
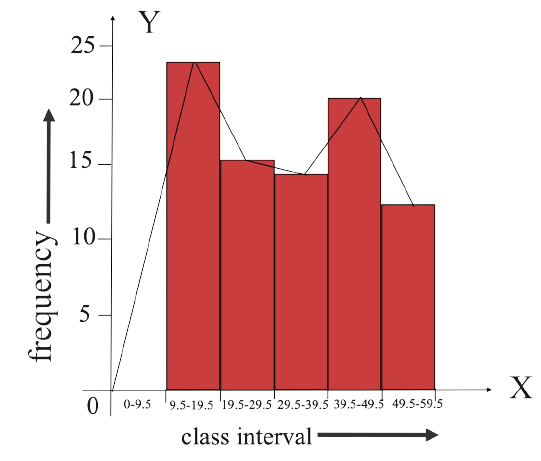
(iii)
Ans:
Steps of Construction:
Convert the data to its exclusive form. (Adjustment factor is 0.5)
Using appropriate scales, mark class intervals on the x-axis and frequency on the y-axis.
Draw rectangles with class intervals as bases and frequencies as heights.
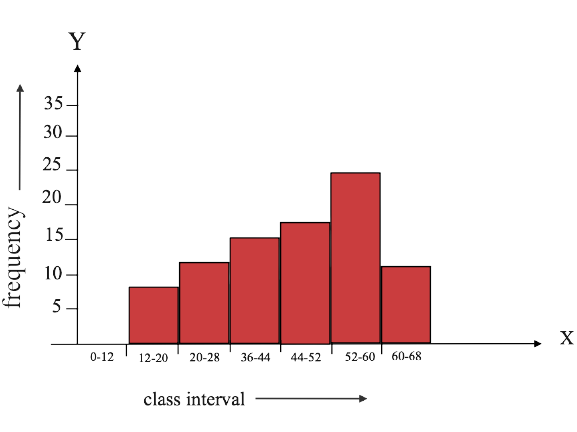
(iv)
Ans:
Steps of Construction:
Convert the class marks to intervals.
Using appropriate scales, mark class intervals on the x-axis and frequency on the y-axis.
Draw rectangles with class intervals as bases and frequencies as heights.
2. Draw a cumulative frequency curve (ogive) for each of the following distributions:
(i)
Ans:
Steps of Construction:
Using appropriate scales, trace class intervals on the x-axis and frequency on the y-axis.
Draw rectangles with class intervals as bases and frequencies as heights.
To make the ogive, join the rectangle's midpoints.
(ii)
Ans:
Steps of Construction:
Convert the data into the exclusive form. (Adjustment factor is 0.5)
Using appropriate scales, draw class intervals on the x-axis and frequencies on the y-axis.
Draw rectangles with class intervals as bases and frequencies as heights.
To obtain ogive, join the rectangle's midpoints.
3. Draw an ogive for each of the following distributions:
(i)
Ans: Steps of Construction:
On the graph, plot the points (10, 8), (20, 25), (30, 38), (40, 50), and (50, 67).
Obtain an ogive by joining them with your free hand.

(ii)
Ans: Steps of Construction:
On the graph, plot the points (10, 0), (20, 17), (30, 32), (40, 37), (50, 53), (60, 58) and (70, 65)
Obtain an ogive by joining them with your free hand.
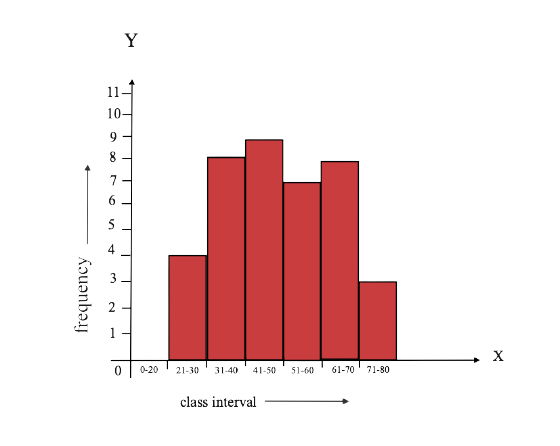
4. Construct a frequency distribution table for the numbers given below, using the class intervals 21 - 30, 31 - 40, .....etc.
75, 67, 57, 50, 26, 33, 44, 58, 67, 75, 78, 43, 41, 31, 21, 32, 40, 62, 54, 69, 48, 47, 51, 38, 39, 43, 61, 63, 68, 53, 56, 49, 59, 37, 40, 68, 23, 28, 36, and 47.
Use the table obtained to draw:
A Histogram
Ans: Individual class intervals can be used to count the frequency.
Now, from the class interval 21 - 30, the numbers occurring in the above mentioned distributions are 21, 23, 26, 28 = 4.
31 - 40 $\to $ 31, 32, 33, 36, 37, 38, 39, 40
41 - 50 $\to $ 41, 43, 43, 44, 47, 47, 48, 49, 50
51 - 60 $\to $ 51, 53, 54, 56, 57, 58, 59
61 - 70 $\to $ 61, 62, 63, 67, 67, 68, 68, 69
71 - 80 $\to $ 75, 75, 78
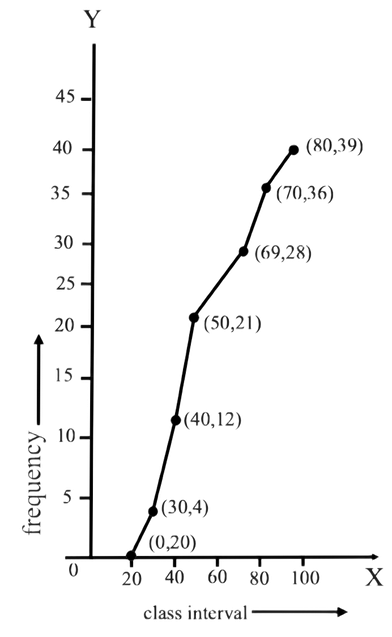
An Ogive
Ans:
To draw an ogive, plot the points (30, 4), (40, 12), (50, 21), (60, 28), (70, 36), and (80, 39) on the graph and join them with your free hand.
5. (a) Use the information given in the adjoining histogram to construct a frequency table.
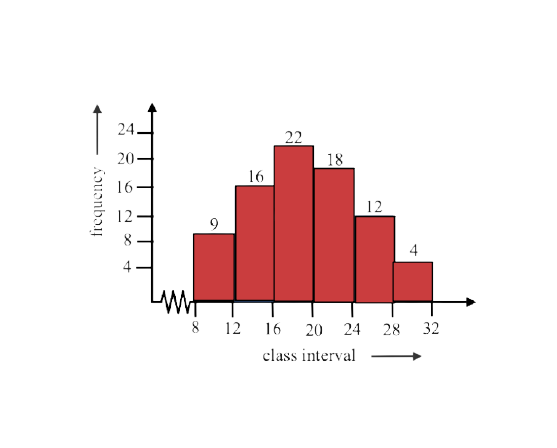
Ans: (a)
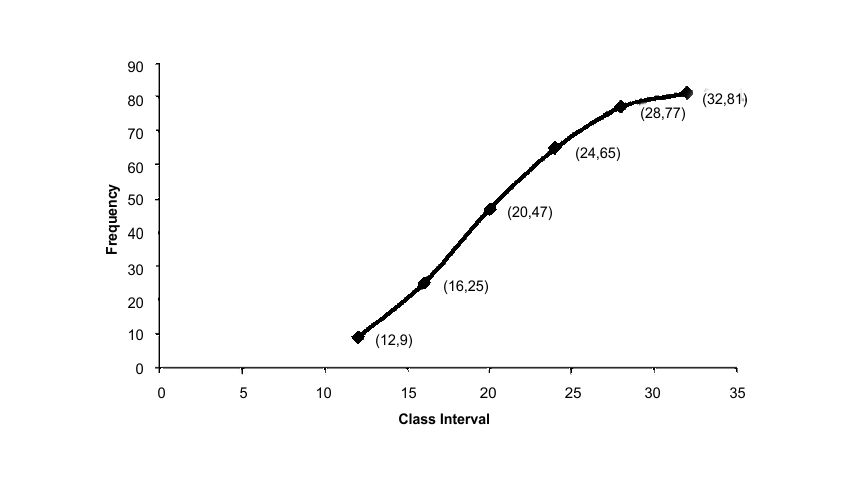
(b) Use this table to construct an ogive.
Ans: To obtain an ogive, plot and connect the points (12, 9), (16, 25), (20, 47), (24, 65), (28, 77), and (32, 81).
6.
(a) From the distribution, given above, construct a frequency table.
Ans: Differences in consecutive class marks = 17.5 - 12.5 = 5
Therefore, the first class interval will be 10-15 and so on.
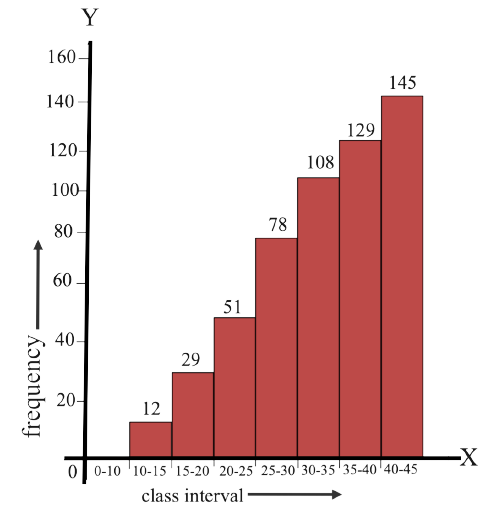
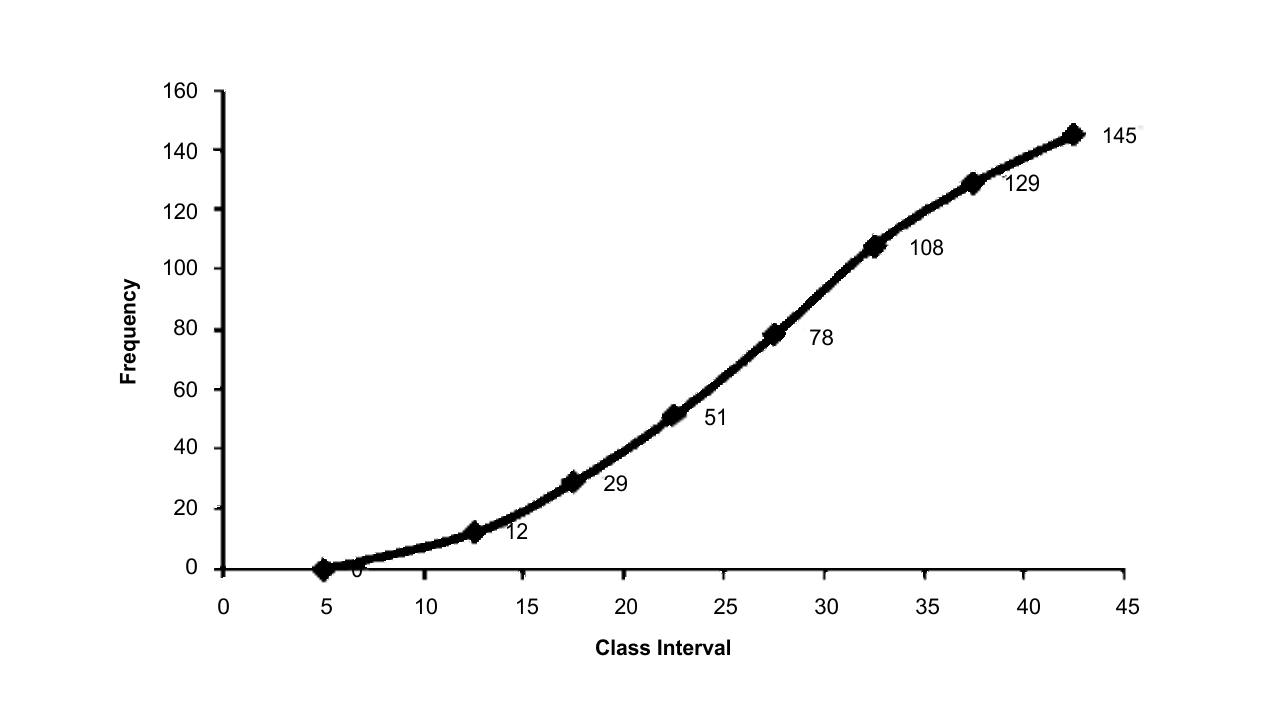
Use the table obtained in part (a) to draw : (i) a histogram, (ii) an ogive.
Ans: To make an ogive, join the points (15, 12), (20, 29), (25, 51), (30, 78), (35, 108), (40, 129) and (45, 145).
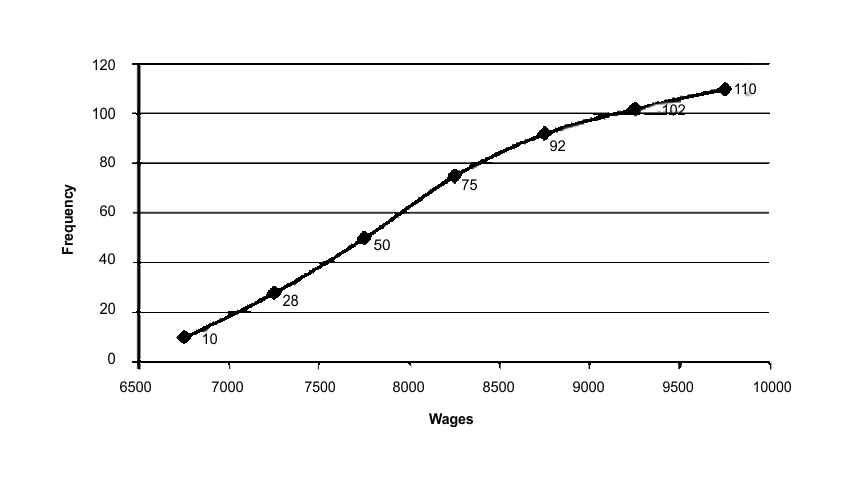
7. Use graph paper for this question.
The table given below shows the monthly wages of some factory workers.
(i) Using the table, calculate the cumulative frequencies of workers.
Use 2cm = ₹500, starting the origin at ₹6500 on x-axis, and 2 cm = 10 workers on the y-axis.
Ans:
(ii) Draw a cumulative frequency curve.
Ans: To make an ogive, join the points (7000, 10), (7500, 28), (8000, 50), (8500, 75), (9000, 92), (9500, 102) and (10000, 110).
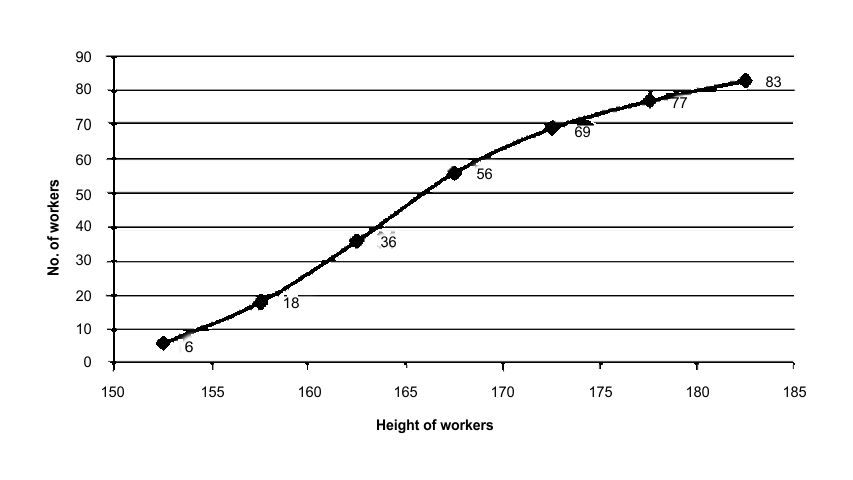
8. The following table shows the distribution of the heights of a group of factory workers:
(i) Determine the cumulative frequencies.
Ans:
(ii) Draw the 'less than' cumulative frequency curve on graph paper. Use 2cm = 5cm height on one axis and 2cm = 10 workers on the other.
Ans: Draw an ogive by connecting the points (155, 6), (160, 18), (165, 36), (170, 56), (175, 69), (180, 77), and (185, 83) on the graph.
9. Construct a frequency distribution table for each of the following distributions :
(i)
Ans:
(ii)
Ans:
Textbook For The Preparation Of Class 10 Chapter 23 Mathematics, Icse Board:
For the preparation of the board exam, students can get the use of Selina Concise mathematics Class 10 solutions for Chapter 23. Chapter 23 in mathematics is all about graphical representation, it does require proper guidance to score in this topic. It contains all the possible sums and a detailed explanation for every problem. These explanations are in a step-by-step manner so that students can easily understand the concept. It is also important to know that step marks help in boosting the mathematics score. Students will be awarded for the steps, irrespective of the final solution.
How Vedantu Helps In The Preparation Of Class 10 Mathematics?
To commence the preparation, the first step will be to analyse the syllabus. It has a lot of importance because the syllabus will help you figure out the important questions and the high weightage concepts. You cannot waste time looking at all the previous question papers and understanding the importance of every concept. Thus, to ease this, the Vedantu website has uploaded the syllabus for Class 10 mathematics subjects. The updated syllabus is available which follows the guidelines of the ICSE board members. It is available for free download. Avoid the methods that are consuming your time and go for the easy methodology of preparing for the exam.
Importance of Selina Concise Textbook For Class 10:
Once done with syllabus learning, start your preparation with the Selina Concise mathematics textbook for Class 10. This follows all the ICSE guidelines. This textbook will guide you throughout the preparation process. It has solutions for all problems. Try solving all the problems given in the textbook. The questions in the textbook are from the beginners level (easy) to a higher level (hard). After practising with the textbook, practise the important questions given on the website, you can download the link given on the website for free. This will help you understand how questions will be in the final exam.
And, the final step of your preparation would be to practice the mock test material. Mock tests act as a preview for your exam, the questions in the test paper are the most expected questions. They are also available for free to download. Do not skip the revision part, it is as important as the syllabus.


FAQs on Concise Mathematics Class 10 ICSE Solutions for Chapter 23 - Graphical Representation (Histograms, Frequency Polygon and Ogives)
1. Why is it important to learn to interpret graphical representation in Class 10 ICSE board?
It is important to learn about this so that we could understand graphing which is a fundamental part of algebra and other maths courses that are yet to come. Also, interpreting graphs involves what the shape of a curve represents in a real-life situation. An understanding and interest in plotting points are important before you start your preparation for this subject. It also helps you get a strong base in algebra and other fundamental mathematics. There are different types of representation of graphs available.
2. How does Vedantu help in the preparation for the Class 10 mathematics with ICSE Class 10 Mathematics Chapter 23 Selina Concise Solutions - Free PDF Download?
The Vedantu website is considered to be one of the top sites which provides reliable materials for the students. From the updated syllabus which follows all the guidelines to the important questions that are set by the subject teachers to the mock test PDFs. all these materials are unique and are found useful for the students. They come with solutions in it, these solutions are explained in a step-by-step manner. Students can reach out if they have any doubt.
3. Is it necessary to read all the questions given in the ICSE Class 10 Mathematics Chapter 23 Selina Concise Solutions - Free PDF Download?
Yes, practice with the textbook is mandatory because it helps you understand the concept properly and in-depth so that it makes your fundamentals strong. The questions are from the beginners level to the tough level, you can get trained in facing every level of problems in the textbook. Once done with the textbook preparation, students can download the online materials and practise them. It gives an idea about a variety of problems. You can download the material for free on the Vedantu website.
4. How can I reach out if I have any doubt solutions for Chapter 23 Class 10 mathematics, ICSE board?
Students can reach out if there are any doubts. Students can reach out to the Vedantu website and post their doubts. Students can write their doubts on the Vedantu website and our team will work and sort the problem and will get back to you once the doubts are sorted. You will be acknowledged within 30 minutes of posting the doubt on the website. Or students can also get the doubts clarified by registering themselves to the online doubt clarification sessions that are handled by the Vedantu’s subject expert.
5. What is the best solution for NCERT Class 10 Chapter 23 ICSE syllabus?
The best textbook for the Class 10 mathematics Chapter 23 for the ICSE board will be Selina Concise solutions for the ICSE syllabus. This is because it follows all the guidelines set by the ICSE board and it contains the step-by-step solutions for every problem. This helps the students to understand every problem in a detailed manner. This also has solutions with explanations. This explanation will help students to understand the need for every step. Hence this textbook is recommended. This is available on the Vedantu website. Make use of it.