


NCERT Exemplar for Class 9 Maths - Statistics and Probability - Free PDF Download
Sample Questions
1. The marks obtained by 17 students in a mathematics test (out of 100) are given below:
91, 82, 100, 100, 96, 65, 82, 76, 79, 90, 46, 64, 72, 68, 66, 48, 49.
The range of the data is:
(A) 46
(B) 54
(C) 90
(D) 100
Ans: Option (B)
The range of data is the difference of the highest value and the lowest value.
In the given question, the highest value is 100 and the lowest value is 46.
Therefore, the range = 100 - 46 = 54
2. The class-mark of the class 130-150 is:
(A) 130
(B) 135
(C) 140
(D) 145
Ans: Option (C)
${\text{Class - mark}} =\dfrac{{{\text{lower}}\,{\text{limit}} + {\text{higher}}\,{\text{limit}}}}{2}$
$=\dfrac{{130 + 150}}{2}$
$=\dfrac{{280}}{2}$
$= 140$
3. A die is thrown 1000 times and the outcomes were recorded as follows:
If the die is thrown once more, then the probability that it shows 5 is:
(A) $\dfrac{9}{{50}}$
(B) $\dfrac{3}{{20}}$
(C) $\dfrac{4}{{25}}$
(D) $\dfrac{7}{{25}}$
Ans: Option (B)
Probability of an event is the ratio of the number of possible outcomes to the number of total outcomes. Let A be the event that the outcome is 5. Therefore,
$P(A) =\dfrac{{{\text{Number of possible outcome}}}}{{{\text{Total number of outcome}}}}$
$P(A) =\dfrac{{150}}{{1000}} =\dfrac{3}{{20}}$
Exercise 14.1
Write the correct answer in each of the following:
1. The class mark of the class 90-120 is:
(A) 90
(B) 105
(C) 115
(D) 120
Ans: Option (B)
${\text{Class - mark}} =\dfrac{{{\text{lower}}\,{\text{limit}} + {\text{higher}}\,{\text{limit}}}}{2}$
$=\dfrac{{90 + 120}}{2}$
$=\dfrac{{210}}{2}$
$= 105$
2. The range of the data:
25, 18, 20, 22, 16, 6, 17, 15, 12, 30, 32, 10, 19, 8, 11, 20 is
(A) 10
(B) 15
(C) 18
(D) 26
Ans: Option (D)
The range of data is the difference of the highest value and the lowest value. In the given question, the highest value is 32 and the lowest value is 6.
Therefore, the range = 32 - 6 = 26
3. In a frequency distribution, the mid value of a class is 10 and the width of the class is 6. The lower limit of the class is:
(A) 6
(B) 7
(C) 8
(D) 12
Ans: Option (B)
The Mid-Value of the class is 10.
Width of the interval is 6.
${\text{lower limit}} = {\text{mid value}} -\dfrac{{{\text{width}}}}{2}$
$= 10 -\dfrac{6}{2}$
$= 10 - 3$
$= 7$
4. The width of each of five continuous classes in a frequency distribution is 5 and the lower class-limit of the lowest class is 10. The upper class-limit of the highest class is:
(A) 15
(B) 25
(C) 35
(D) 40
Ans: Option (C)
Lower class limit is 10.
Width of each of five continuous classes is 5.
Total Width till upper class limit $= 5 \times 5 = 25$.
Therefore, the upper-class limit of the highest class is the sum of the lower-class limit and the total width till upper class limit $= 10 + 25 = 35$.
5. Let $m$ be the mid-point and $l$ be the upper-class limit of a class in a continuous frequency distribution. The lower-class limit of the class is:
(A) $2m + 1$
(B) $2m - 1$
(C) $m - 1$
(D) $m - 2$
Ans: Option (B)
Let the lower-class limit be $z$.
The upper-class limit is given as $l$.
${\text{mid}}\,{\text{point}} =\dfrac{{{\text{lower - class limit}}\,{\text{ + }}\,{\text{upper - class limit}}}}{2}$
Therefore, $m =\dfrac{{z + l}}{2}$
Hence, $z = 2m - l$
6. The class marks of a frequency distribution are given as follows:
15, 20, 25, ...
The class corresponding to the class mark 20 is:
(A) 12.5 – 17.5
(B) 17.5 – 22.5
(C) 18.5 – 21.5
(D) 19.5 – 20.5
Ans: Option (B)
Mean of 15 and 20 = $\dfrac{{15 + 20}}{2} = 17.5$
Mean of 20 and 25 = $\dfrac{{20 + 25}}{2} = 22.5$
Here, the lower-class limit is mean of 15 and 20.
Similarly, the upper-class limit is the mean of 20 and 25.
So, the class interval for class mark 20 is 17.5 - 22.5.
7. In the class intervals 10-20, 20-30, the number 20 is included in:
(A) 10 - 20
(B) 20 - 30
(C) both the intervals
(D) none of these intervals
Ans: Option (B)
The number 20 is included in the class interval 20 – 30 because the lower-limit of the class interval is always counted first.
8. A grouped frequency table with class intervals of equal sizes using 250-270 (270 not included in this interval) as one of the class-interval is constructed for the following data:
268, 220, 368, 258, 242, 310, 272, 342, 310, 290, 300, 320, 319, 304, 402, 318, 406, 292, 354, 278, 210, 240, 330, 316, 406, 215, 258, 236.
The frequency of the class 310-330 is:
(A) 4
(B) 5
(C) 6
(D) 7
Ans: Option (C)
Given data is:
268, 220, 368, 258, 242, 310, 272, 342, 310, 290, 300, 320, 319, 304, 402, 318, 406, 292, 354, 278, 210, 240, 330, 316, 406, 215, 258, 236.
Out of the given data, the numbers that lie in the class 310-330 are:
310, 310, 320, 319, 318, 316.
(The presence of 310 does not matter for the interval 310 – 330 because it will not be counted in this interval)
The frequency of numbers that lie in class 310 – 330 = 6
9. A grouped frequency distribution table with classes of equal sizes using 63-72 (72 included) as one of the class is constructed for the following data:
30, 32, 45, 54, 74, 78, 108, 112, 66, 76, 88, 40, 14, 20, 15, 35, 44, 66, 75, 84, 95, 96, 102, 110, 88, 74, 112, 14, 34, 44.
The number of classes in the distribution will be:
(A) 9
(B) 10
(C) 11
(D) 12
Ans: Option (A)
Given data points are:
30, 32, 45, 54, 74, 78, 108, 112, 66, 76, 88, 40, 14, 20, 15, 35, 44, 66, 75, 84, 95, 96, 102, 110, 88, 74, 112, 14, 34, 44.
Given class is 63 – 72 (where 72 is included)
Range of the given class 63 – 72 = 10.
Range of the given data points is 112 – 14 = 98
Number of classes in the given distribution is $\dfrac{{{\text{Range of data points}}}}{{{\text{Range of given class}}}}$$ =\dfrac{{98}}{{10}} = 9.8$
Since, the number of classes is always a whole number, then the number of classes for this distribution is 10.
10. To draw a histogram to represent the following frequency distribution
the adjusted frequency for the class 25-45 is:
(A) 6
(B) 5
(C) 3
(D) 2
Ans: Option (D)
So, the adjusted frequency for the class 25 – 45 is 2
11. The mean of five numbers is 30. If one number is excluded, their mean becomes 28. The excluded number is:
(A) 28
(B) 30
(C) 35
(D) 38
Ans: Option (D)
The mean of 5 numbers is = 30
Let the number which is excluded be $x$.
After excluding $x$, the mean is = 28
Let the other numbers be ${a_1}$, ${a_2}$, \[{a_3}\]and \[{a_4}\].
Therefore, \[30 =\dfrac{{{a_1} + {a_2} + {a_3} + {a_4} + x}}{5}\]…………equation 1
And \[28 =\dfrac{{{a_1} + {a_2} + {a_3} + {a_4}}}{4}\]
S0, \[{a_1} + {a_2} + {a_3} + {a_4} = 28 \times 4 = 112\]……………..equation 2
Putting the value of equation 2 in equation 1.
$30 =\dfrac{{112 + x}}{5}$
$150 = 112 + x$
$x = 38$
12. If the mean of the observations:
\[x, x + 3, x + 5, x + 7, x + 10\] is 9, the mean of the last three observations is
(A) \[10\dfrac{1}{3}\]
(B) \[10\dfrac{2}{3}\]
(C) \[11\dfrac{1}{3}\]
(D) \[11\dfrac{2}{3}\]
Ans: Option (C)
Mean of given observations = 9
Observations are: \[x, x + 3, x + 5, x + 7, x + 10\]
Therefore,
$9 =\dfrac{x + x + 3 + x + 5 + x + 7 + x + 10}{5}$
$9 =\dfrac{5x + 25}{5}$
$9 = x + 5$
$x = 4$
So, the mean of last three observations is
$\dfrac{9 + 11 + 14}{3} =\dfrac{34}{3} = 11\dfrac{1}{3}$
13. If $\overline x $ represents the mean of $n$ observations ${x_1},{x_2},.....,{x_n},$ then value of $\sum\limits_{i = 1}^n {({x_i} - \bar x)} $ is:
(A) \[--\,1\]
(B) $0$
(C) $1$
(D) $n - 1$
Ans: Option (B)
Mean of $n$ observations ${x_1},{x_2},.....,{x_n} = \,\bar x$
Therefore, $\bar x\, = \,\dfrac{\sum\limits_{i = 1}^n {{x_i}} }{n}$
$ \Rightarrow \sum\limits_{i = 1}^n {{x_i}\, = \,n\bar x} $ then,
$\sum\limits_{i = 1}^n {({x_i} - \bar x)} = \sum\limits_{i = 1}^n {{x_i}\, - \,\sum\limits_{i = 1}^n {\bar x} }$
$= \,n\bar x - \,\bar x\sum\limits_{i = 1}^n {1\,\,\,\left[ {{\text{and}}\,\sum\limits_{i = 1}^n 1 \, = \,n} \right]}$
$=n\bar{x}-\bar{x}.n$
$= \,0$
Hence, the value of $\sum\limits_{i=1}^{n}{({{x}_{i}}-\bar{x})}=0$.
14. If each observation of the data is increased by $5$, then their mean
(A) remains the same
(B) becomes $5$ times the original mean
(C) is decreased by $5$
(D) is increased by $5$
Ans: Option (D)
Assume mean of $n$ observations be ${x_1},{x_2},.....,{x_n}$$ = \,\bar x$
Let’s represent the older mean by ${\bar x_{old}}$ then,
${\bar x_{old}} = \dfrac{{\sum\limits_{i = 1}^n {{x_i}} }}{n}$
Now, new mean by adding $5$ in each observation, becomes
Representing new mean by ${\bar x_{new}}$ therefore,
${{\bar x}_{new}} = \dfrac{{\left( {{x_1} + 5} \right) + \left( {{x_2} + 5} \right) + ..... + \left( {{x_n} + 5} \right)}}{{n}}$
$=\dfrac{{({x_1} + {x_2} + .... + {x_n}) + 5n}}{{n}}$
$=\frac{\sum\limits_{i=1}^{n}{{{x}_{i}}}}{n}+5={{\bar{x}}_{old}}+5\left[ \because \frac{\sum\limits_{i=1}^{n}{{{x}_{i}}}}{n}={{{\bar{x}}}_{old}} \right]$
$\therefore {{\bar x}_{new}} = {{\bar x}_{old}} + 5$
Hence, the new mean is increased by $5$.
15. Let $\bar x$ be the mean of ${x_1},{x_2}, \ldots ,{x_n}$ and $\bar y$ the mean of ${y_1},{y_2} \ldots ,{y_n}$. If $\bar z$ is the mean of ${x_1},{x_2}, \ldots ,{x_n}$, ${y_1},{y_2} \ldots ,{y_n}$, then $\bar z$ is equal to
(A) $\bar x + \bar y$
(B) $\dfrac{{\bar x + \bar y}}{2}$
(C) $\dfrac{{\bar x + \bar y}}{n}$
(D) $\dfrac{{\bar x + \bar y}}{{2n}}$
Ans: Option (B)
If $\bar x$$ = \dfrac{{\sum x}}{n}$ where, $\bar x$ is the mean of ${x_1},{x_2}, \ldots ,{x_n}$
Therefore, $n\bar x = \sum x$
Similarly, $\bar y =\dfrac{{\sum y}}{n} \Rightarrow n\bar y = \sum y$
Given that $\bar z$ is the mean of ${x_1},{x_2}, \ldots ,{x_n}$, ${y_1},{y_2} \ldots ,{y_n}$ then
$\bar z =\dfrac{{\sum x + \sum y}}{{n + n}}$
$= \dfrac{{n \bar x + n \bar y}}{{2n}}$
$= \dfrac{{n\left( {\bar x + \bar y} \right)}}{{2n}}$
$=\dfrac{{\left( {\bar x + \bar y} \right)}}{2}$
Hence, $\bar z =\dfrac{{\left( {\bar x + \bar y} \right)}}{2}$.
16. If $\bar x$ is the mean of ${x_1},{x_2}, \ldots ,{x_n}$, then for $a \ne 0$, the mean of \[a{x_1},a{x_2},...,a{x_n},\dfrac{{{x_1}}}{a},\dfrac{{{x_2}}}{a},...,\dfrac{{{x_n}}}{a}\]is
(A) $\left( {a +\dfrac{1}{a}} \right)\bar x$
(B) $\left( {a +\dfrac{1}{a}} \right)\dfrac{{\bar x}}{2}$
(C) $\left( {a +\dfrac{1}{a}} \right)\dfrac{{\bar x}}{n}$
(D) $\dfrac{{\left( {a +\dfrac{1}{a}} \right)\bar x}}{{2n}}$
Ans: Option (B)
Given that $\bar x$is the mean of ${x_1},{x_2}, \ldots ,{x_n}$then
$\dfrac{{{x_1} + {x_2}....{x_n}}}{n} = \bar x$
Similarly, the mean of \[a{x_1},a{x_2},...,a{x_n}\] is:
$\dfrac{{a{x_1},a{x_2},...,a{x_n}}}{{an}} = \bar x$
$\dfrac{{a{x_1},a{x_2},...,a{x_n}}}{{an}} = a\bar x$
Also the mean of
$\dfrac{{\dfrac{1}{a}{x_1} +\dfrac{1}{a}{x_2} + ....\dfrac{1}{a}{x_n}}}{{\dfrac{1}{a}n}} = \bar x$
$\dfrac{{\dfrac{1}{a}{x_1} +\dfrac{1}{a}{x_2} + ....\dfrac{1}{a}{x_n}}}{n} =\dfrac{{\bar x}}{a}$
Then the mean of $a{x_1},a{x_2},...,a{x_n},\dfrac{{{x_1}}}{a},\dfrac{{{x_2}}}{a},...,\dfrac{{{x_n}}}{a}$ is given by
$\dfrac{{a\bar x +\dfrac{{\bar x}}{a}}}{2} =\dfrac{{\bar x}}{2}\left( {a +\dfrac{1}{a}} \right)$
Hence, the mean of $a{x_1},a{x_2},...,a{x_n},\dfrac{{{x_1}}}{a},\dfrac{{{x_2}}}{a},...,\dfrac{{{x_n}}}{a} =\dfrac{{\bar x}}{2}\left( {a +\dfrac{1}{a}} \right)$.
17. If ${\bar x_1},{\bar x_2},{\bar x_3},....{\bar x_n}$ are the means of $n$ groups with ${n_1},{n_2},...{n_n}$ number of observations respectively, then the mean $\bar x$ of all the groups taken together is given by:
(A) $\sum\limits_{i = 1}^n {{n_i}{{\bar x}_i}} $
(B) $\dfrac{{\sum\limits_{i = 1}^n {{n_i}{{\bar x}_i}} }}{{{n^2}}}$
(C) $\dfrac{{\sum\limits_{i = 1}^n {{n_i}{{\bar x}_i}} }}{{\sum\limits_{i = 1}^n {{n_i}} }}$
(D) $\dfrac{{\sum\limits_{i = 1}^n {{n_i}{{\bar x}_i}} }}{{2n}}$
Ans: Option (C)
Mean of all the groups together is given by total sum divided by total count.
i.e., $ =\dfrac{{{\text{total sum}}}}{{{\text{total count}}}}$
If $\bar x$ is the mean of one group then mean of $n$ group is given by $n\bar x$
Therefore, mean is given by
Mean $ =\dfrac{{\sum\limits_{i = 1}^n {{n_i}{{\bar x}_i}} }}{{\sum\limits_{i = 1}^n {{n_i}} }}$
18. The mean of $100$ observations is $50$. If one of the observations which was $50$ is replaced by $150$, the resulting mean will be:
(A) \[50.5\]
(B) \[51\]
(C) \[51.5\]
(D) 52
Ans: Option (B)
Given that, number of observations i.e., $\bar x = \,100$
Also $n = 100$
And ${\text{mean}}\,{\text{ = }}\,50$
We know that, ${\text{mean}}\,{\text{ = }}\dfrac{{\sum\limits_{i = 1}^n {{x_i}} }}{n}$
Substituting the value
$\dfrac{1}{{100}} \times \sum\limits_{i = 1}^{100} {{x_i} = 50} $
$ \Rightarrow \sum\limits_{i = 1}^{100} {{x_i}} = 5000$
If observation $50$ is replaced by $150$ then
$\sum\limits_{i = 1}^{100} {{x_i} = 5000 - 50 + 150}$
$\sum\limits_{i = 1}^{100} {{x_i}} = 5100$
Required mean is given by $=\dfrac{{\sum\limits_{i = 1}^{100} {{x_i}} }}{{100}}$ $=\dfrac{{5100}}{{100}} = 51$
Hence the required mean is $51$.
19. There are $50$ numbers. Each number is subtracted from $53$ and the mean of the numbers so obtained is found to be $ - 3.5$. The mean of the given numbers is:
(A) $46.5$
(B) $49.5$
(C) $53.5$
(D) $56.5$
Ans: Option (D)
Given number of observations are $ = 50$i.e., \[n = 50\]
$\bar x =\dfrac{{\sum\limits_{i = 1}^n {{x_i}} }}{n}$
$\bar x =\dfrac{{\sum\limits_{i = 1}^{50} {{x_i}} }}{{50}}$
$\sum\limits_{i = 1}^{50} {{x_i}} = 50\bar x$
If each number is subtracted from $53$ and there are $50$ numbers then its new mean is given by ${\bar x_{new}}$
${{\bar x}_{new}} =\dfrac{{\left( {53 - {x_1}} \right) + \left( {53 - {x_2}} \right) + ....\left( {53 - {x_n}} \right)}}{{50}}$
$\dfrac{{\left( {53 - {x_1}} \right) + \left( {53 - {x_2}} \right) + ....\left( {53 - {x_n}} \right)}}{{50}} = - 3.5$
$- 3.5 \times 50 = - \left( {{x_1} + {x_2} + ....{x_{50}}} \right) + 53 \times 50$
$\sum\limits_{i = 1}^{50} {{x_i}} = 2650 + 175 = 2825$
Therefore, mean of $50$observation is
$=\frac{1}{50}\sum\limits_{i=1}^{50}{{{x}_{i}}}$
$=\dfrac{1}{{50}} \times 2825 = 56.5$
Hence, the mean is $56.5$
20. The mean of $25$ observations is $36$. Out of these observations if the mean of first $13$ observations is $32$ and that of the last $13$ observations is $40$, the $1{3^{th}}$ observation is:
(A) $23$
(B) $36$
(C) $38$
(D) $40$
Ans: Option (B)
According to the question, the mean of $25$ observation is $ = \,36$.
Therefore, Sum of $25$ observation is $ = \,25 \times 36 = 900$.
Now, the mean of the first $13$ observation is $32$.
So, sum of first $13$ observation $ = 13 \times 32$$ = 416$
And mean of last $13$ observation is $40$
So, sum of last $13$ observation $ = 13 \times 40 = 520$
Therefore, ${13^{th}}$ observation $= \left( {{\text{sum of last 13 observation + sum of first 13 observation}}} \right) - \left( {{\text{sum of 25 observation}}} \right)$
$= \left( {520 + 416} \right) - 900$
$= 936 - 900$
$= 36$
Hence, ${13^{th}}$ observation is 36.
21. The median of the data \[78,56,22,34,45,54,39,68,54,84\] is:
(A) $45$
(B) $49.5$
(C) $54$
(D) $56$
Ans: Option (C)
We know that, when number of observations $n$ is even, the median is given by
Mean or average of $ \Rightarrow {\left( {\dfrac{n}{2}} \right)^{th}}$and ${\left( {\dfrac{n}{2} + 1} \right)^{th}}$
For finding the median of the given data it is first arranged in ascending order as follows:
$22,34,39,45,54,54,56,68,78\,{\text{and }}84$,
Now, number of observations $\left( n \right) = 10$
$\therefore {\left( {\dfrac{n}{2}} \right)^{th}}{\text{term}} = \,{\left( {\dfrac{{10}}{2}} \right)^{th}}{\text{term}}$
$\text{ = }{{\text{5}}^{th}}\text{ term i}\text{.e}\text{., }54\text{ from the data arranged in ascending order}$
Similarly, for ${\left( {\dfrac{n}{2} + 1} \right)^{th}}{\text{term}}$
$\Rightarrow {\left( {\dfrac{{10}}{2} + 1} \right)^{th}}{\text{term = }}\,{\left( {5 + 1} \right)^{th}}{\text{term}}$
$\Rightarrow {{\text{6}}^{th}}\,{\text{term i}}{\text{.e}}{\text{., 54 from the data arranged in ascending order}}$
Now,
${\text{Median}} =\dfrac{{{{\left( {\dfrac{n}{2}} \right)}^{th}}{\text{observation + }}{{\left( {\dfrac{n}{2} + 1} \right)}^{th}}{\text{observation}}}}{2}$
$=\dfrac{{54 + 54}}{2}$
$=\dfrac{{108}}{2} = 54$
Hence, the median of given data is $54$.
22. For drawing a frequency polygon of a continuous frequency distribution, we plot the points whose ordinates are the frequencies of the respective classes and abscissa are respectively:
(A) upper limits of the classes
(B) lower limits of the classes
(C) class marks of the classes
(D) upper limits of preceding classes
Ans: Option (C)
The mid-points of the classes i.e., Class marks are the abscissa of the points, which we plot for frequency polygon.
23. Median of the following number \[4,4,5,7,6,7,7,12,3\] is:
(A) $4$
(B) $5$
(C) $6$
(D) $7$
Ans: Option (C)
Median of the given data with number of observations $\left( n \right)$ is odd =${\left( {\dfrac{{n + 1}}{2}} \right)^{th}}{\text{term}}$
Arranging the given data in ascending order
\[3,4,4,5,6,7,7,7,12\]
${\text{Median = }}{\left( {\dfrac{{n + 1}}{2}} \right)^{th}}{\text{term}}$
$= \,{\left( {\dfrac{{9 + 1}}{2}} \right)^{th}}{\text{term}}$
$=\,{\left( {\dfrac{{10}}{2}} \right)^{th}}{\text{term}}$
\[={{5}^{th}}\text{term i}\text{.e}\text{., 6 from the data arranged in ascending order}\]
$=\,{\text{6}}$
Hence, the median is $6$.
24. Mode of the data \[15,14,19,20,14,15,16,14,15,18,14,19,15,17,15\]is
(A) $14$
(B) $15$
(C) $16$
(D) $17$
Ans: Option (B)
The observation that has maximum frequency is called Mode. In the given set of data observation $15$ has frequency $5$ i.e., it occurs more times than other observations. Hence mode of the given data is $15$.
25. In a sample study of $642$ people, it was found that $514$ people have a high school certificate. If a person is selected at random, the probability that the person has a high school certificate is:
(A) 0.5
(B) 0.6
(C) 0.7
(D) 0.8
Ans: Option (D)
Probability of an event ${\text{P}}\left( {\text{E}} \right) =\dfrac{{{\text{Number of favorable outcomes}}}}{{{\text{Total outcomes}}}}$
Number of people with high school certificate $ = 514$
Total number of people $ = $$642$
${\text{Probability that a person has high school certificate}} =\dfrac{{{\text{number of people with high school certificate}}}}{{{\text{total number of people}}}}$
$=\dfrac{{514}}{{642}}$
$= 0.8$
Hence, probability is $0.8$.
26. In a survey of $364$ children aged $19$-$36$ months, it was found that $91$ liked to eat potato chips. If a child is selected at random, the probability that he/she does not like to eat potato chips is:
(A) $0.25$
(B) $0.50$
(C) $0.75$
(D) $0.80$
Ans: Option (C)
Given that, Total number of children aged from $19$-$36$$ = 364$
Number of children that liked to eat potato $ = 91$
Favourable outcomes $ = {\text{n}}\left( {\text{E}} \right)$
Total outcome $ = {\text{n}}\left( {\text{S}} \right)$
${\text{Probability that a child likes potato}}\,{\text{chips = }}\,\dfrac{{{\text{Number of children that like potatoes}}}}{{{\text{Total number of children}}}}$
Probability that a child likes potato chips $ =\dfrac{{{\text{n}}\left( {\text{E}} \right)}}{{{\text{n}}\left( {\text{S}} \right)}}$
$=\dfrac{{91}}{{364}}$
$= 0.25$
$\therefore {\text{P}}\left( {\text{E}} \right) = 0.25$
Now, the probability that he/she does not like to eat potato chips:
$= 1 - {\text{P}}\left( {\text{E}} \right)$
$= 1 - 0.25$
$= 0.75$
Hence, the probability that he/she does not like to eat potato chips is $0.75$.
27. In a medical examination of students of a class, the following blood groups are recorded:
A student is selected at random from the class. The probability that he/she has blood group B, is:
(A)$\dfrac{1}{4}$
(B)$\dfrac{{13}}{{40}}$
(C)$\dfrac{3}{{10}}$
(D)$\dfrac{1}{8}$
Ans: Option (C)
Number of students having blood group B, ${\text{n}}\left( {\text{E}} \right)$ $ = 12$
Total number of students, ${\text{n}}\left( {\text{S}} \right)$$ = \,\left( {10 + 12 + 13 + 5} \right)$$ = 40$
Probability that a student selected at random has blood group B, ${\text{P}}\left( {\text{E}} \right)$$ =\dfrac{{{\text{n}}\left( {\text{E}} \right)}}{{{\text{n}}\left( {\text{S}} \right)}}$
$\Rightarrow\dfrac{{12}}{{40}} = 0.3$
$\Rightarrow\dfrac{3}{{10}}$
Hence, the probability that he/she has blood group B, is $\dfrac{3}{{10}}$.
28. Two coins are tossed $1000$ times and the outcomes are recorded as below:
Based on this information, the probability for at most one head is
(A) $\dfrac{1}{5}$
(B) $\dfrac{1}{4}$
(C) $\dfrac{4}{5}$
(D) $\dfrac{3}{4}$
Ans: Option (C)
Total number of coins tossed, ${\text{n}}\left( {\text{S}} \right)$$ = 1000$.
Number of outcomes with utmost one head, ${\text{n}}\left( {\text{E}} \right) = 550 + 250 = 800$
Therefore,
${\text{P}}\left( {\text{E}} \right) =\dfrac{{{\text{n}}\left( {\text{E}} \right)}}{{{\text{n}}\left( {\text{S}} \right)}}$
$=\dfrac{{800}}{{1000}}$
$=\dfrac{4}{5}$
Hence, the probability of utmost one head is $\dfrac{4}{5}$
29. $80$ bulbs are selected at random from a lot and their life time (in hrs) is recorded in the form of a frequency table given below:
One bulb is selected at random from the lot. The probability that its life is $1150$ hours, is
(A) $\dfrac{1}{{80}}$
(B) $\dfrac{7}{{16}}$
(C) $0$
(D) $1$
Ans: Option (C)
Total bulb, ${\text{n}}\left( {\text{S}} \right) = 80$
Number of bulb with lifetime $1150\,{\text{hrs}}$, ${\text{n}}\left( {\text{E}} \right) = \,0$
Probability that lifetime is $1150\,{\text{hrs}}$, ${\text{P}}\left( {\text{E}} \right) =\dfrac{{{\text{n}}\left( {\text{E}} \right)}}{{{\text{n}}\left( {\text{S}} \right)}}$
$ \Rightarrow\dfrac{0}{{80}} = 0$
Hence, the probability of lifetime $1150\,{\text{hrs}}$ is $0$.
30. Refer to Q.29 above:
The probability that bulbs selected randomly from the lot has life less than $900$ hours is:
(A) $\dfrac{{11}}{{40}}$
(B) $\dfrac{5}{{16}}$
(C) $\dfrac{7}{{16}}$
(D) $\dfrac{9}{{16}}$
Ans: Option (D)
Number of bulbs with lifetime less than $900$${\text{hours}}$, ${\text{n}}\left( {\text{E}} \right)$$ = \,10 + 12 + 23 = 45$
Total number of bulbs in a lot, ${\text{n}}\left( {\text{S}} \right) = 80$
Probability that number of bulbs with lifetime less than $900$${\text{hours}}$, ${\text{P}}\left( {\text{E}} \right) =\dfrac{{{\text{n}}\left( {\text{E}} \right)}}{{{\text{n}}\left( {\text{S}} \right)}}$
$ \Rightarrow\dfrac{{45}}{{80}} =\dfrac{9}{{16}}$
Hence, the of probability that number of bulbs with lifetime less than $900$${\text{hours}}$, is $\dfrac{9}{{16}}$
Short Answer Questions with Reasoning
Sample Questions
1. The mean of the data: \[2, 8, 6, 5, 4, 5, 6, 3, 6, 4, 9, 1, 5, 6, 5\] is given to be 5. Based on this information, is it correct to say that the mean of the data \[: 10,{\text{ }}12, 10, 2, 18, 8, 12, 6, 12, 10, 8, 10, 12, 16, 4 is 10\] ? Give a reason.
Ans: It is correct. The mean of the 2nd data will be 2 times the mean of the 1st data because the 2nd data is obtained by multiplying each observation of the 1st data by 2.
2. In a histogram, the areas of the rectangles are proportional to the frequencies. Can we say that the lengths of the rectangles are also proportional to the frequencies?
Ans: Yes. We can say that the lengths of the rectangles are proportional to the frequencies in a histogram because the area of the rectangle is proportional to its frequency.
The shape of rectangles in a histogram shows how different sets of data are represented according to class intervals and frequency. The following list of points will help you understand this.
The rectangles used to represent any data in a histogram are determined by the class interval and frequency.
The length of the rectangle determines the area of the rectangle.
The length of the rectangle and the frequency are proportional because the area of the rectangle is proportional to its frequency.
As a result, the rectangle's length is proportional to the frequencies.
As a result, in a histogram, the lengths of the rectangles are proportional to the frequencies.
3. Consider the data: \[2, 3, 9, 16, 9, 3, 9.\] Since 16 is the highest value in the observations, is it correct to say that it is the mode of the data? Give a reason.
Ans: The data is not in the mode of 16. The observation with the highest frequency, not the observation with the highest value, is the mode of a given set of data.
Exercise 14.2
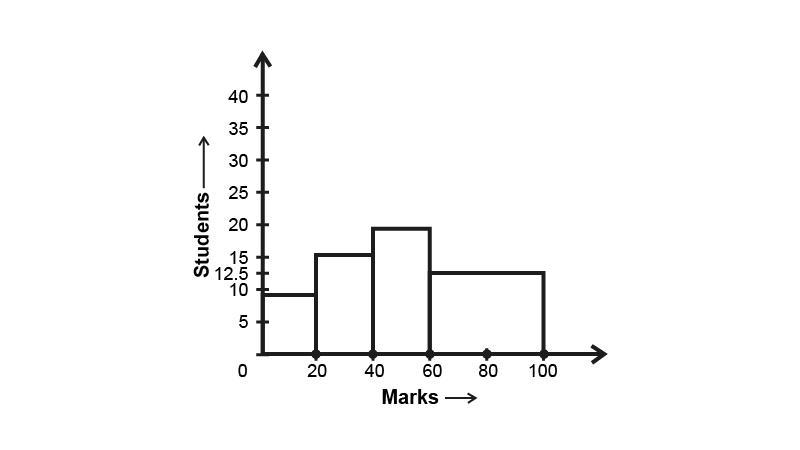
1. The frequency distribution has been represented graphically as follows:
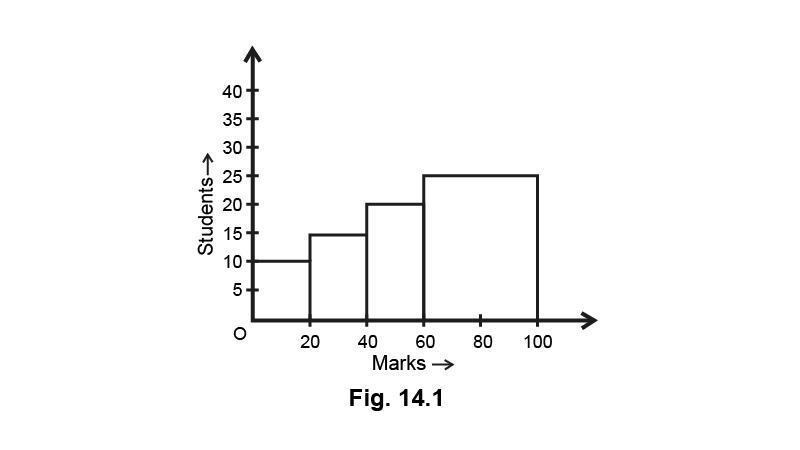
Do you think this representation is correct? Why?
Ans: No, here the widths of the rectangles are varying, so we need to make certain modifications in the length of the rectangles so that the areas are proportional to the frequencies. We proceed as follows:
(i) Select a class interval with the minimum class size, here the minimum class size is 20.
(ii) The length of the rectangles are then modified to be proportionate to the class size 20.
Now, we get the following modified table
So, the correct histogram with varying width is given below
2. In a diagnostic test in mathematics given to students, the following marks (out of 100) are recorded: \[46, 52, 48, 11, 41, 62, 54, 53, 96, 40, 98, 44\] Which ‘average’ will be a good representative of the above data and why?
Ans: We can represent the given data using median as,
(i) each value occurs once.
(ii) The data is influenced by extreme values.
3. A child says that the median of \[3, 14, 18, 20, 5 is 18\]. What doesn’t the child understand about finding the median?
Ans: Since the child says that the median of \[3,{\text{ }}14,{\text{ }}18,{\text{ }}20,{\text{ }}5{\text{ is }}18\], it is clear that the child doesn’t understand the fact that the given data should be arranged in ascending or descending order before finding the middle term, i.e., median.
Arranging the given data in ascending order, we get,
3, 5, 14, 18, 20
As the number of terms is odd, median will be the middle term ${\left( {\dfrac{{n + 1}}{2}} \right)^{th}}$term
The \[{\text{median }} = {\left( {\dfrac{{5 + 1}}{2}} \right)^{rd}}{\text{term}} = {\left( {\dfrac{6}{2}} \right)^{rd}}{\text{term}} = {3^{rd}}{\text{term}} = 14\]
4. A football player scored the following number of goals in the 10 matches: \[1, 3, 2, 5, 8, 6, 1, 4, 7, 9\] Since the number of matches is 10 (an even number), therefore, the \[median =\dfrac{{{5^{th}}observation + {6^{th}}observation}}{2} =\dfrac{{8 + 6}}{2} = 7\] ,is it the correct answer and why?
Ans: No, the obtained data solution in the question is not the correct answer, because the data has to be arranged in either ascending or descending order before finding the median. Now, arranging the data in ascending order, we get,
\[1,1,2,3,4,5,6,7,8,9\]
Here, the number of observations is 10, which is even.
So, \[{\text{median}} = \left( {\dfrac{{{{\left( {\dfrac{n}{2}} \right)}^{th}}{\text{observation + }}{{\left( {\dfrac{n}{2}{\text{ + 1}}} \right)}^{th}}{\text{observation}}}}{2}} \right)\]
\[ = \left( {\dfrac{{{{\left( {\dfrac{{10}}{2}} \right)}^{th}}{\text{observation + }}{{\left( {\dfrac{{10}}{2}{\text{ + 1}}} \right)}^{th}}{\text{observation}}}}{2}} \right)\]
\[ = \left( {\dfrac{{{5^{th}}{\text{observation + }}{{\text{6}}^{th}}{\text{observation}}}}{2}} \right)\]
$ =\dfrac{{(4 + 5)}}{2}$
$ = \left( {\dfrac{9}{2}} \right)$
$ = 4.5$
5. Is it correct to say that in a histogram, the area of each rectangle is proportional to the class size of the corresponding class interval? If not, correct the statement.
Ans: It is not correct, because in a histogram, the area of each rectangle is proportional to the corresponding frequency of its class.
6. The class marks of a continuous distribution are : \[1.04, 1.14, 1.24, 1.34, 1.44, 1.54 \,\text{and}\, 1.64\] Is it correct to say that the last interval will be \[1.55 - 1.73\]? Justify your answer.
Ans: No, the last interval will not be \[1.55{\text{ }} - {\text{ }}1.73\]. Because the difference between two consecutive class marks should be equal to the class size. Here, the difference between two consecutive marks is \[0.1\] and class size of \[1.55 - 1.73{\text{ is }}0.18\] , which are not equal.
7. 30 children were asked about the number of hours they watched TV programmes last week. The result are recorded as under
Can we say that the number of children who watched TV for 10 or more hours in a week is 22? Justify your answer.
Ans: No, in fact the number of children who watched TV for 10 or more hours in a week is $4 + 2$ i.e. 6.
8. Can the experimental probability of an event be a negative number? If not, why?
Ans: No, since the number of trials in which the event can happen cannot be negative and the total number of trials is always positive.
9. Can the experimental probability of an event be greater than 1? Justify your answer.
Ans: No, since the number of trials in which the event can happen cannot be greater than the total number of trials.
10. As the number of tosses of a coin increases, the ratio of the number of heads to the total number of tosses will be $\dfrac{1}{2}$. Is this correct? If not, write the correct one.
Ans: No, since the number of coin increases, the ratio of the number of heads to the total number of tosses will be nearer to $\dfrac{1}{2}$ but not exactly $\dfrac{1}{2}$.
Sample Questions
1. Heights (in cm) of 30 girls of Class IX are given below:
140, 140, 160, 139, 153, 153, 146, 150,
148, 150, 152, 146, 154, 150, 160, 148,
150, 148, 140, 148, 153, 138, 152, 150,
148, 138, 152, 140, 146, 148.
Prepare a frequency distribution table for this data.
Ans: Frequency distribution of heights of 30 girls
2. The following observations are arranged in ascending order :
$26, 29, 42, 53, x, x + 2, 70, 75, 82, 93$
If the median is 65, find the value of $x$.
Ans: Number of observations $(n) = 10$, which is even. Therefore, median is the mean of ${\left( {\dfrac{n}{2}} \right)^{{\text{th }}}}$ and ${\left( {\dfrac{n}{2} + 1} \right)^{{\text{th }}}}$ observation, i.e., ${5^{{\text{th }}}}$ and ${6^{{\text{th }}}}$ observation.
Here, $\quad {5^{{\text{th }}}}$ observation $ = x$
${6^{{\text{th }}}}{\text{ observation }} = x + 2{\text{ }}$
${\text{Median }} =\dfrac{{x + (x + 2)}}{2} = x + 1$
Now, $\quad x + 1 = 65$ (Given)
Therefore, $x = 64$
Thus, the value of $x$ is 64.
3. Here is an extract from a mortality table.
(i) Based on this information, what is the probability of a person ‘aged 60’ of dying within a year?
(ii) What is the probability that a person ‘aged 61’ will live for 4 years?
Ans: (i) We see that \[16090\] persons aged 60, \[\left( {16090 - 11490} \right),\]i.e., \[4600\] died before reaching their 61st birthday
Therefore, ${\text{P}}($ a person aged 60 die within a year $) =\dfrac{{4600}}{{16090}} =\dfrac{{460}}{{1609}}$
(ii) Number of persons aged 61 years = 11490
Number of persons surviving for 4 years = 2320
P(a person aged 61 will live for 4 years) = \[\dfrac{{2320}}{{11490}} =\dfrac{{232}}{{1149}}\]
Exercise 14.3
1. The blood groups of 30 students are recorded as follows:
A, B, O, A, AB, O, A, O, B, A,
O, B, A, AB, B, A, AB, B, A, A,
O, A, AB, B, A, O, B, A, B, A.
Prepare a frequency distribution table for the data.
Ans: The number of students who have a certain type of blood group is called the frequency of those blood groups. A frequency distribution table for the given data is given below
2. The value of \[\pi \] up to 35 decimal places is given below: \[3. 14159265358979323846264338327950288\]
Make a frequency distribution of the digits 0 to 9 after the decimal point.
Ans: The frequency of those digits is defined as the number of times they are repeated. The following is a frequency distribution table for the given data.
3. The scores (out of 100) obtained by 33 students in a mathematics test are as follows:
69, 48, 84, 58, 48, 73, 83, 48, 66, 58, 84,
66, 64, 71, 64, 66, 69, 66, 83, 66, 69, 71,
81, 71, 73, 69, 66, 66, 64, 58, 64, 69, 69.
Represent this data in the form of a frequency distribution.
Ans: The Number of students who have the same marks in mathematics is called the frequency of that mark. A frequency distribution table for the given data is given below
4. Prepare a continuous grouped frequency distribution from the following data:
Also find the size of class intervals.
Ans: Here, we see that the difference between two midpoints is $15 - 5$ i.e., 10 . It means the width of the class interval is 10. Let the lower limit of the first class interval be a. Then, its upper limit $ = a + 10$
Now, mid value of the first class interval $ = 5$
$ \Rightarrow \quad $ Mid value $ =\dfrac{{{\text{ Lower limit + Upper limit }}}}{2}$
$\Rightarrow 5 =\dfrac{{a + a + 10}}{2}$
$\Rightarrow 2a + 10 = 10$
$\Rightarrow 2a = 0$
$\Rightarrow a = 0$
So, the first class interval is $0 - 10$. Now, we prepare a continuous grouped frequency distribution table is given below
Hence, the size of the class interval is 10 i.e., $0 - 10$.
5. Convert the given frequency distribution into a continuous grouped frequency distribution:
In which intervals would 153.5 and 157.5 be included?
Ans: It is clear that the given table is in inclusive (discontinuous) form. So, we first convert it into an exclusive form.
Now, consider the classes \[150 - 153,154 - 157\] Lower limit of \[154 - 157{\text{ }} = {\text{ }}154\] and upper limit of \[150 - 153 = 153\] Required difference \[ = {\text{ }}154{\text{ }} - 153{\text{ }} = {\text{ }}1\]
So, half the difference \[ =\dfrac{1}{2} = {\text{ }}0.5\]
So, we subtract 0.5 from each lower limit and add 0.5 to each upper limit.
The table for continuous grouped frequency distribution is given below
Thus, 153.5 and 157.5 will lie in the class interval 153.5 - 157.5 and 157.5 - 161.5, respectively.
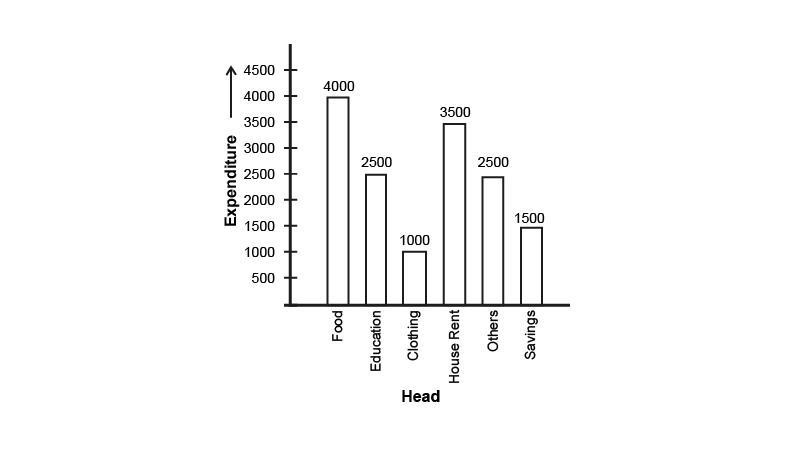
6. The expenditure of a family on different heads in a month is given below:
Draw a bar graph to represent the data above.
Ans: The bar graph for the following data is represented by
Scale : \[1{\text{ unit }} = {\text{ Rs}}{\text{. }}500\]
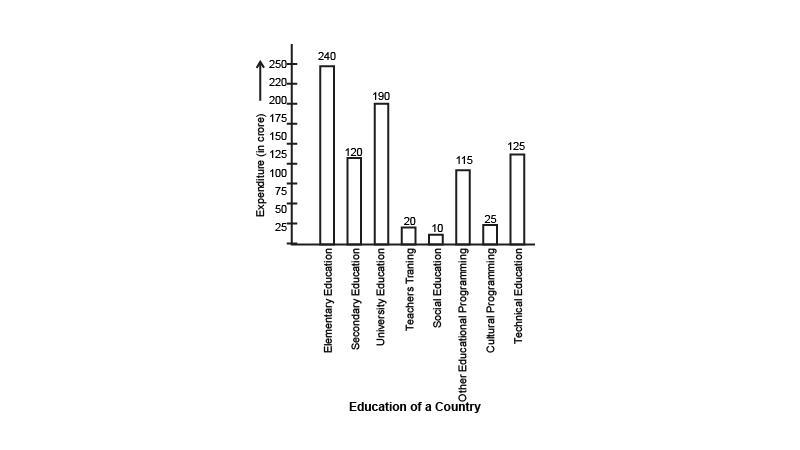
7. Expenditure on education of a country during a five years period (2002-2006), in crore of rupees, is given below
Represent the information above by a bar graph.
Ans: The bar graph for the above given data is represented by
Scale : \[1{\text{ unit }} = {\text{ }}25{\text{ crores}}\]
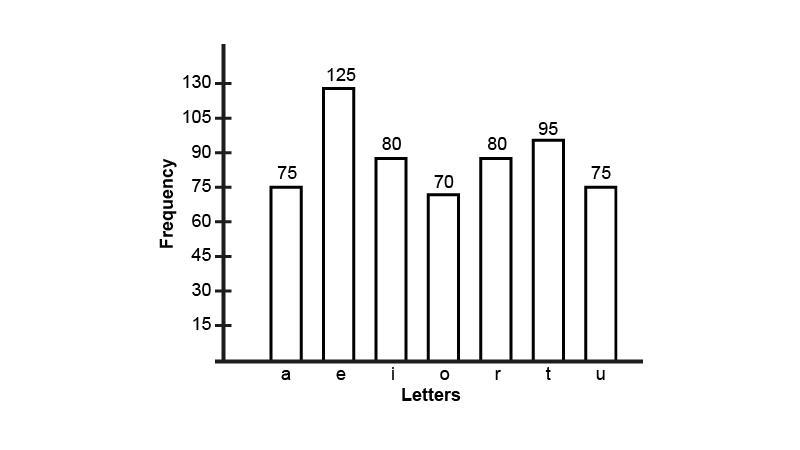
8. The following table gives the frequencies of most commonly used letters o, e, i, o, r, t, u, from a page of a book
Represent the information above by a bar graph.
Ans: Representing the information above by a bar graph.
Scale : $1{\text{ unit }} = 15{\text{ frequency}}$
9. If the mean of the following data is 20.2, find the value of p:
Ans: We know that, Mean of the data $(\bar x) =\dfrac{{\sum\limits_{i = 1}^5 {{f_i}} {x_i}}}{{\sum\limits_{i = 1}^5 {{f_i}} }} = 20.2\quad $ [given]
$\Rightarrow \dfrac{{{f_1}{x_1} + {f_2}{x_2} + {f_3}{x_3} + {f_4}{x_4} + {f_5}{x_5}}}{{{t_1} + {t_2} + {t_3} + {f_4} + {f_5}}} = 20.2$
$\Rightarrow \dfrac{{(6)(10) + (8)(15) + (p)(20) + (10)(25) + (6)(30)}}{{6 + 8 + p + 10 + 6}} = 20.2$
$\Rightarrow \dfrac{{60 + 120 + 20p + 250 + 180}}{{30 + p}} = 20.2$
$\Rightarrow 20p + 610 = 606 + 20.2p$
$\Rightarrow 610 - 606 = 02p$
$\Rightarrow \dfrac{{2p}}{{10}} = 4$
$\therefore p = 10 \times 2 = 20$
Hence, the value of $p$ is 20.
10. Obtain the mean of the following distribution:
Ans: We know that,
Mean of the data $(\bar x) =\dfrac{{\sum\limits_{i = 1}^5 {{f_i}} {x_i}}}{{\sum\limits_{i = 1}^5 {{f_i}} }} =\dfrac{{{f_1}{x_1} + {t_2}{x_2} + {f_3}{x_3} + {f_4}{x_4} + {f_5}{x_5}}}{{{f_1} + {t_2} + {t_3} + {f_4} + {f_5}}}$
$=\dfrac{{4 \times 4 + 8 \times 6 + 14 \times 8 + 11 \times 10 + 3 \times 12}}{{4 + 8 + 14 + 11 + 3}}$
$=\dfrac{{16 + 48 + 112 + 110 + 36}}{{40}}$
$=\dfrac{{322}}{{40}}$
$= 8.05$
Hence, the mean of the given data is 8.05.
11. A class consists of \[50\] students out of which \[30\] are girls. The mean of marks scored by girls in a test is \[73\] (out of \[100\]) and that of boys is \[71\]. Determine the mean score of the whole class.
Ans: A class consists of \[50\] students out of which \[30\] are girls.
The mean marks of \[30\] girls $ = 73$
Total score of \[30\] girls
$ = 73 \times 30 = 2190$
Now, number of boys are
$50 - 30 = 20$
The mean marks of \[20\] boys $ = 71$
Total score of boys
$ = 71 \times 20 = 1420$
$ \Rightarrow $ Here, the total score of whole class =${\text{Total score of all girls + Total score of all boys}}$
\[ = 2190 + 1420 = 3610\]
Mean of all students $ =\dfrac{\text{ Total marks of all students }}{\text{ Total number of students}}$
$ =\dfrac{{3610}}{{50}} = 72.2$
Hence, the mean of whole class is $72.2$
12. Mean of \[50\] observations was found to be \[80.4\]. But later on, it was discovered that \[96\] was misread as \[69\] at one place. Find the correct mean.
Ans: Mean of \[50\] observations was found to be \[80.4\]${\text{(Incorrect mean)}}$
${\text{The incorrect sum of all the numbers}}$= \[{\text{Incorrect mean x Total numbers}}\]
$ = 80.4 \times 50 = 4020$
It was discovered that \[96\] was misread as \[69\] at one place
Hence the correct sum of all the numbers
$ = 4020 - 69 + 96 = 4047$
So correct mean $\dfrac{{4047}}{{50}} = 80.94$
Hence, the correct mean is $80.94$.
13. Ten observations \[{\text{6, 14, 15, 17, }}x{\text{ + }}{\text{1, 2}}x - {\text{13, 30, 32, 34, 43}}\] are written in an ascending Order. The median of the data is \[24\]. Find the value of $x$.
Ans: Here, the observations are:
\[{\text{6, 14, 15, 17, }}x{\text{ + }}{\text{1, 2}}x - {\text{13, 30, 32, 34, 43}}\]
To calculate the median, arrange the given data in ascending order and then find the middle term. This middle term is called the median. The terms are already given in ascending order so we have to find the middle term.
Number of terms, ${\text{n}} = 10$ (even)
So, Median = average of ${\left( {\dfrac{{\text{n}}}{2}} \right)^{{\text{th}}}}$ and ${\left( {\dfrac{{\text{n}}}{2} + 1} \right)^{{\text{th}}}}$ term
$ \Rightarrow $ Median $ = 24$ (given)
$24 =\dfrac{{{{\left( {\dfrac{{10}}{2}} \right)}^{{\text{th}}}}{\text{ observation }} + {{\left( {\dfrac{{10}}{2} + 1} \right)}^{{\text{th}}}}{\text{ observation}}}}{2}$
$24 =\dfrac{{{5^{{\text{th}}}}{\text{obs }} + {\text{ }}{6^{{\text{th}}}}{\text{obs}}}}{2}$
$24 =\dfrac{{x + 1 + 2x - 13}}{2}$
$ \Rightarrow 2 \times 24 = x + 1 + 2x - 13$
$ \Rightarrow 48 = 3x - 12$
$ \Rightarrow 48 + 12 = 3x$
$ \Rightarrow 60 = 3x$
$ \Rightarrow x = 20$
Hence, the correct answer is $20$.
14. The points scored by a basketball team in a series of matches are as follows: \[17,2,7,27,25,5,14,18,10,24,48,10,8,7,10,28\]
Find the median and mode for the data.
Ans: \[\left[ {{\text{median = 12and mode = 10}}} \right]\]
To calculate the median, arrange the given data in ascending order and then find the middle term. This middle term is called the median.
Here total elements, ${\text{n}} = 16$ (even)
the terms as arranged in ascending order:
\[17,2,7,27,25,5,14,18,10,24,48,10,8,7,10,28\]
Number of observation $ = 16$ (even number)
now using the formula of the median in case number of terms is even
$ =\dfrac{{{{\left( {\dfrac{{16}}{2}} \right)}^{{\text{th}}}}{\text{observation}} + {{\left( {\dfrac{{16}}{2} + 1} \right)}^{{\text{th}}}}{\text{observation}}}}{2}$
Median $ =\dfrac{{\left( {{8^{{\text{th}}}}{\text{observation}} + {9^{{\text{th}}}}{\text{observation}}} \right)}}{2}$
$ \Rightarrow\dfrac{{10 + 14}}{2} =\dfrac{{24}}{2}$
Median $ = 12$
The mode is the value that occurs the maximum number of times in a given set of values. Now mode is \[10\] because it is the most repeating number.
Hence, \[\left[ {{\text{median = 12and mode = 10}}} \right]\]
15. In the given histogram depicting the daily wages of workers in a factory. Construct the frequency distribution table.
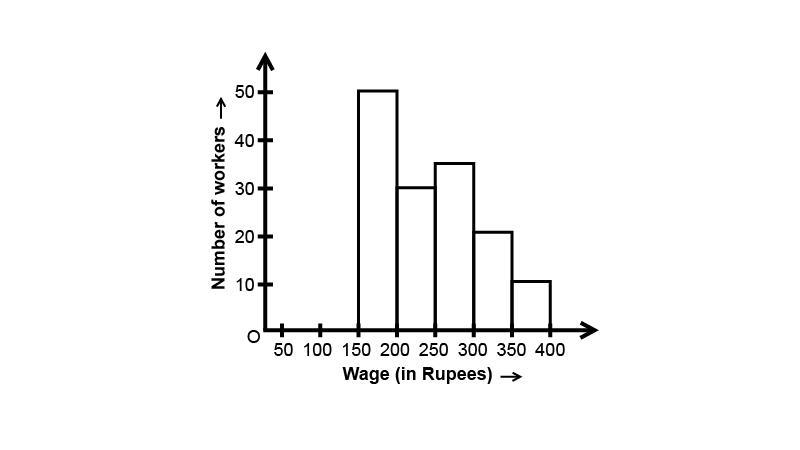
Ans: Based on the given bar graph:
16. A company selected 4000 households at random and surveyed them to find out a relationship between income level and the number of television sets in a home. The information so obtained is listed in the following table:
Find the probability:
(i) of a household earning Rs $10000 - $ Rs \[14999\] per year and having exactly one television.
(ii) of a household earning Rs \[25000\] and more per year and owning $2$ televisions.
(iii) of a household not having any television.
Ans: Here, total events $ = 4000$
(i) A household earning Rs $10000 - $Rs \[14999\] per year and having exactly one television.
Favorable outcomes $ = 240$
${\text{Probability = }}\dfrac{{{\text{Favourable outcomes}}}}{{{\text{Total number of events}}}}$
Required probability $ =\dfrac{{240}}{{4000}} =\dfrac{3}{{50}} = {\text{0}}{\text{.06}}$
(ii) A household earning Rs \[25000\] and more per year and owning $2$ televisions.
Favorable outcomes $ = 760$
${\text{Probability = }}\dfrac{{{\text{Favourable outcomes}}}}{{{\text{Total number of events}}}}$
Required probability $ =\dfrac{{760}}{{4000}} = 0.19$
(iii) A household not having any television.
Favorable outcomes $ = 20 + 10$
${\text{Probability = }}\dfrac{{{\text{Favourable outcomes}}}}{{{\text{Total number of events}}}}$
Required probability $ =\dfrac{{30}}{{4000}} =\dfrac{3}{{400}} = 0.0075$
17. Two dice are thrown simultaneously \[500\] times. Each time the sum of two numbers appearing on their tops is noted and recorded as given in the following table:
If the dice are thrown once more, what is the probability of getting a sum
$(i)$ Equal to 3?
\[\left( {ii} \right)\] More than 10 ?
$(iii)$ less than or equal to 5?
$(iv)$ between 8 and 12
Ans: Here, total events $ = 14 + 30 + 42 + 55 + 72 + 75 + 70 + 53 + 46 + 28 + 15 = 500$
(i) Probability of getting a sum$ = 3$
Favorable events $ = 30$
${\text{P}}$ Of getting sum 3 $ =\dfrac{{30}}{{500}} = 0.06$
(ii) Probability of getting a sum more than 10
Favorable events $ = 28 + 15 = 43$
${\text{P}}$ Of getting sum 10 $ =\dfrac{{43}}{{500}} = 0.086$
(iii) Probability of getting a sum less than or equal to 5
Favorable events $ = 14 + 30 + 42 + 55$
${\text{P}}$ sum less than or equal to 5 $ =\dfrac{{141}}{{500}} =\dfrac{{28.2}}{{100}} = 0.282$
(iv) Probability of getting a sum between 8 and 12
Favorable events $ = 53 + 46 + 28 = 127$
${\text{P}}$ Sum between 8 and 12 $ =\dfrac{{127}}{{500}} = 0.254$
18. Bulbs are packed in cartons each containing 40 bulbs. Seven hundred cartons were examined for defective bulbs and the results are given in the following table:
One carton was selected at random. What is the probability that it has
(i) No defective bulb?
(ii) Defective bulbs from \[2 \,to\, 6 ?\]
(iii) defective bulbs less than 4?
Ans: Probability is defined as $ =\dfrac{{{\text{ Favourable outcomes }}}}{{{\text{ Total number of events }}}}$
Here, total events = total cartons $ = 700$
(i) No defective bulb
Favorable outcomes $ = 400$
${\text{P}}$(Cartoon has no defective bulb) $ =\dfrac{{400}}{{700}} =\dfrac{4}{7}$
(ii) Defective bulbs from \[{\text{2 to 6 = 2 or 3 or 4 or 5 or 6}}\] defective bulbs
Favorable outcomes $ = 48 + 41 + 18 + 8 + 3 = 118$
${\text{P}}$(Defective bulb from 2 to 6)$ =\dfrac{{118}}{{700}} =\dfrac{{59}}{{350}}$
(iii) Defective bulbs less than $4 = $ defective bulbs equal to \[{\text{0 or 1 or 2 or 3}}\]
Favorable outcomes $ = 400 + 180 + 48 + 41 = 669$ ${\text{P}}$ (defective bulbs less than 4)$ =\dfrac{{669}}{{700}}$
19. Over the past 200 working days, the number of defective parts produced by a machine is given in the following table:
Determine the probability that tomorrow’s output will have
(i) no defective part
Ans: Probability is defined as $ =\dfrac{{{\text{ Favourable outcomes }}}}{{{\text{ Total number of events }}}}$
Here, total events = total number of working days $ = 200$
Favorable outcomes $ = 50$ days $ = 50$
${\text{P}}$ (No defective part) $ =\dfrac{{50}}{{200}} = 0.25$
(ii) at least one defective part
Ans: Probability that at least one defective part =\[{\text{1}} - {\text{the probability that no defective part}}\]
${\text{P}}$ (No defective part) $ =\dfrac{{50}}{{200}} = 0.25$
${\text{P}}$ (At least one defective part) $ = 1 -\dfrac{{50}}{{200}} = 0.75$
(iii) not more than 5 defective parts
Ans: Not more than 5 defective parts $ = 0$ or \[{\text{1 or 2 or 3 or 4 or 5}}\] defective parts
${\text{P}}$ (Not more than 5 defective parts) $ = {\text{P}}$(No defective part) $ + {\text{ P}}$(1 defective part) $ + {\text{ P}}$(2 defective part) ${\text{ + P}}$(3 Defective part) $ + {\text{P}}$(4 defective part) $ + {\text{ P}}$(5 defective part)
$ =\dfrac{{50}}{{200}} +\dfrac{{32}}{{200}} +\dfrac{{22}}{{200}} +\dfrac{{18}}{{200}} +\dfrac{{12}}{{200}} +\dfrac{{12}}{{200}}$
$ =\dfrac{{50 + 32 + 22 + 18 + 12 + 12}}{{200}} =\dfrac{{146}}{{200}}$
$ =\dfrac{{73}}{{200}} = 0.73$
(iv) more than 13 defective parts
Ans: More than 13 defective parts = not possible
Favorable outcomes $ = 0$
${\text{P}}$(More than 13 defective parts) $ = 0$
20. A recent survey found that the ages of workers in a factory is distributed as follows:
If a person is selected at random, find the probability that the person is:
(i) \[40\] years or more
Ans: Here, total events = total number of worker ${\text{S}} = 38 + 27 + 86 + 46 + 3 = 200$
(i) ${\text{P}}$ (Person is 40 years or more) $ = {\text{P}}$ (Person having age 40 to 49 years) $ + {\text{ P}}$ (Person having age 50 to 59 years) $ + {\text{ P}}$(Having age 60 and above) $ =\dfrac{{86}}{{200}} +\dfrac{{46}}{{200}} +\dfrac{3}{{200}} =\dfrac{{135}}{{200}} = 0.675$
(ii) under \[40\] years
Ans: ${\text{P}}$ (Person is under 40 years) $ = {\text{P}}$ (Person having age 20 to 29 years) ${\text{ + P}}$ (Person having age 30 to 39 years) $ =\dfrac{{38}}{{200}} +\dfrac{{27}}{{200}} =\dfrac{{65}}{{200}} = 0.325$
Hence the different age groups decided the work.
(iii) having age from \[30 to 39\] years
Ans: ${\text{P}}$ (Having age from 30 to 39 years) $ =\dfrac{{27}}{{200}} = 0.135$
(iv) under $60$ but over $39$ years
Ans: ${\text{P}}$ (Under 60 but over 39 years) $ = {\text{P}}$ (person having age 40 to 49 years) ${\text{ + P}}$ (Person having age 50 to 59 years)
$ =\dfrac{{86}}{{200}} +\dfrac{{46}}{{200}} =\dfrac{{132}}{{200}} = 0.66$
Sample Questions
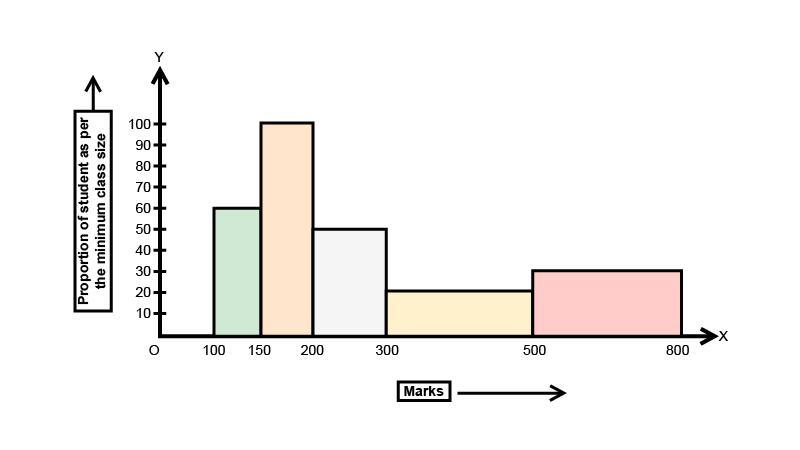
1. Following is the frequency distribution of total marks obtained by the students of different sections of class $VIII$.
Draw a histogram for the distribution above.
Ans: The widths of the class intervals vary for each data in the table given. These widths serve as the width of the rectangles in the histograms. So before drawing histograms the length of the rectangles is to be found in each case. This is due to the property of histogram that the area of the rectangles should be proportional to the frequencies.
Length of each rectangle is given as $\dfrac{c}{C} \times f$, where $c$ is the minimum class width, $C$ is the class width of the particular class and $f$ is the frequency. In the above case $c = 50$. Consider the following table.
So the histogram can be shown by taking $1{\text{ cm}} = 10{\text{ units}}$ on the $x$ axis and $1{\text{ cm}} = 50{\text{ units}}$ on the $y$ axis as below: -
2. Two sections of class $IX$ having $30$ students each appeared for the mathematics Olympiad. The marks obtained by them are shown below:
46 31 74 68 42 54 14 61 83 48 37 26 8 64 57
93 72 53 59 38 16 88 75 56 46 66 45 61 54 27
27 44 63 58 43 81 64 67 36 48 50 76 38 47 55
77 62 53 40 71 60 58 45 42 34 46 40 59 42 29
Construct a grouped frequency distribution of the data above using the classes $0 - 9$, $10 - 19$ etc., and hence find the number of students who secured more than $49$ marks.
Ans: A group frequency distribution of the data is to be made and the classes of those are given like $0 - 9$, $10 - 19$ etc. There are three columns in the table. In the first column there will be classes, in the second column the tally marks and in the third column the frequency represented by the tally marks as per the data given. The boundary values will be included.
The lowest mark is $8$ and the highest mark is $93$ so the starting class will be $0 - 9$ and the ending class will be $90 - 99$.
Clearly the number of students who secured more than $49$ marks $ = \left( {12 + 10 + 6 + 3 + 1} \right) = 32$.
Exercise 14.4
1. The following are the marks (out of 100) of 60 students in mathematics.
\[16,13,5,80,86,7,51,48,24,56,70,19,61,17,16,36,34,42,34,35,72\]
\[55,75,31,52,28,72,97,74,45,62,68,86,35,85,36,81,75,55,26,95,31,7,78\]
\[92,62,52,56,15,63,25,36,54,44,47,27,72,17,4,30\]
Construct a grouped frequency distribution table with width 10 of each class starting from $0 - 9.$
Ans:
Step 1: arrange these numbers in ascending order.
Step 2: Make the frequency distribution table as follows:
The class intervals of $(0 - 9),(10 - 19)$ etc. are given. So we can write the class interval and the corresponding frequency.
2. Construct a grouped frequency distribution table with width 10 of each class, in such a way that one of the classes is $10 - 20$ (20 not included).
Ans:
Step 1: arrange these numbers in ascending order.
\[4,5,9,7,13,15,16,17,17,19,24,25,26,27,28,30,31,34,34,34,35,35,36,36,36,42,44,45,47,48,51\]
\[52,52,54,55,55,56,56,61,62,62,63,68,70,72,72,72,74,75,75,78,80,81,85,86,92,95,97\]
Step 2: Make the frequency distribution table as follows:
The class intervals of $(0 - 10),(10 - 20)$ etc. are given. So we can write the class interval and the corresponding frequency. A value like 10 will always be counted in the interval where it is the lower limit, i.e., 10-20 and not in 0- 10 (where is the higher limit)
3. Draw a histogram of the following distribution:
Ans: To draw the histogram, we have to plot the frequency, i.e., number of students on the y-axis and class Interval, i.e., heights on the x-axis. We can construct the histogram as follows:
Taking $1{\text{ cm on x - axis}} = 3{\text{ units and 1 cm on y - axis}} = 2{\text{ units}}$
4. Draw a histogram to represent the following grouped frequency distribution:
Ans: We can see that the intervals are $20{\text{ - }}24,25{\text{ - }}29,30{\text{ - }}34 \ldots $.etc. First we need to adjust the class interval to make it continuous.
For the interval \[20{\text{ - }}24\]: Upper limit is 24
For the interval $25{\text{ - }}29$ : Lower limit is 25
${\text{Class adjustment value = }}\dfrac{{{\text{Upper class limit }} - {\text{ lower class limit}}}}{2}$
$=\dfrac{{25 - 24}}{2}$
$=\dfrac{1}{2} = 0.5$
Now, we will subtract 0.5 from all lower limits and add 0.5 to all upper limits
Now, we draw the diagram.
Taking $1{\text{ cm on x - axis}} = 5{\text{ units and 1 cm on y - axis}} = 5{\text{ units}}$
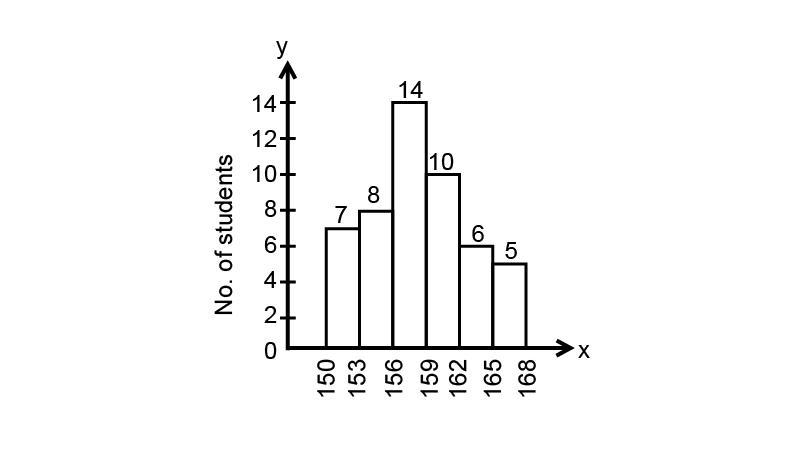
5. The lengths of 62 leaves of a plant are measured in millimeters and the data is represented in the following table:
Draw a histogram to represent the data above.
Ans: We can see that the intervals are $118{\text{ - }}126,127{\text{ - }}135,136{\text{ - }}144 \ldots $ etc. First we need to adjust the class interval to make it continuous.
For the interval \[118{\text{ - }}126\]: Upper limit is 126
For the interval $127 - 135$ : Lower limit is 127
${\text{Class adjustment value = }}\dfrac{{{\text{Upper class limit }} - {\text{ lower class limit}}}}{2}$
$=\dfrac{{25 - 24}}{2}$
$=\dfrac{1}{2} = 0.5$
Now, we will subtract 0.5 from all lower limits and add 0.5 to all upper limits
Hence the histogram is:
Taking $1{\text{ cm on x - axis}} = 9{\text{ units and 1 cm on y - axis}} = 2{\text{ units}}$
6. The marks obtained (out of 100) by a class of 80 students are given below:
Construct a histogram to represent the data above.
Ans: To draw the histogram, we have to plot the frequency, i.e., number of students on the y-axis and class interval, i.e., marks on the x-axis. We can construct the histogram as follows:
Taking $1{\text{ cm on x - axis}} = 10{\text{ units and 1 cm on y - axis}} = 4{\text{ units}}$
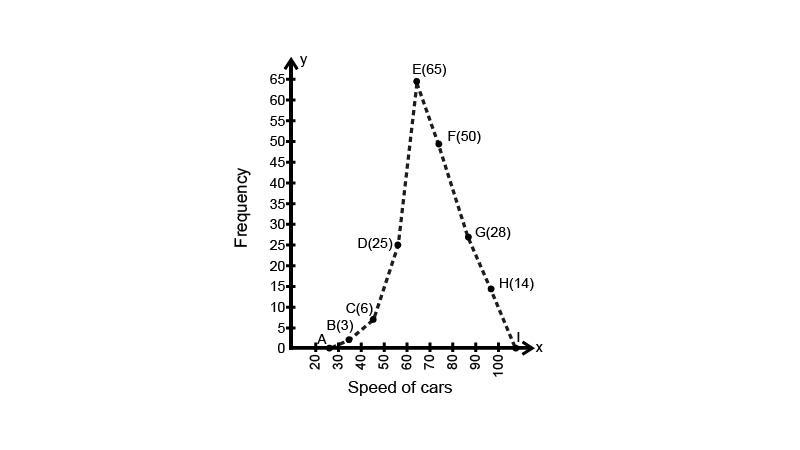
7. Following table shows a frequency distribution for the speed of cars passing through at a particular spot on a highway:
Draw a histogram and frequency polygon representing the data above.
Ans: To draw the histogram, we have to plot the frequency on the y-axis and class interval on the x-axis. We can construct the histogram as follows:
Clearly, the given frequency distribution is in exclusive form. Along the horizontal axis, we represent the class intervals on some suitable scale. The corresponding frequencies are represented along the vertical axis on a suitable scale. We construct rectangles with class intervals as the bases and the respective frequencies as the heights. Let us draw a histogram for this data and mark the mid-points of the top of the rectangles as B, C, D, E, F, G and H, respectively. Here, the first class is 30-40 and the last class is 90-100.
Also, consider the imagined classes 20-30 and 100-110 each with frequency O. The class marks of these classes are 25 and 105 at the points A and I, respectively.
Taking $1{\text{ cm on x - axis}} = 10{\text{ units and 1 cm on y - axis}} = 5{\text{ units}}$
8. Following table shows a frequency distribution for the speed of cars passing through at a particular spot on a highway:
Draw the frequency polygon representing the above data without drawing the histogram.
Ans: A frequency polygon is a graph constructed by using lines to join the midpoints of each interval. Here the midpoints as follows:
We have to draw a frequency polygon without a histogram.
Firstly, we find the class marks of the classes given that is \[30 - 40, 40 - 50, 50 - 60, 60 - 70 \ldots \]
${\text{Class Mark = }}\dfrac{{{\text{actual upper limit + actual lower limit}}}}{2}$
Class mark = \[\left( {\dfrac{{30{\text{ }} + {\text{ }}40}}{2}} \right)\]
\[ \Rightarrow\dfrac{{70}}{2}{\text{ }} = {\text{ }}35\]
Similarly, we can determine the class marks of the other classes.
So, table for class marks is shown below
We can draw a frequency polygon by plotting the class marks along the horizontal axis and the frequency along the vertical axis. Now, plotting all the points \[{\text{B }}\left( {{\text{35, 3}}} \right){\text{, C }}\left( {{\text{45, 6}}} \right){\text{, D }}\left( {{\text{55, 25}}} \right){\text{, E }}\left( {{\text{65, 65}}} \right){\text{, F }}\left( {{\text{75, 50}}} \right){\text{, G }}\left( {{\text{85, 28}}} \right){\text{, H (95, 14)}}\] also plot the point corresponding to the considering classes 20-30 and 100-110 each with frequency 0. Join all these point line segments.
Hence we can construct the points using mid-point on \[x - {\text{axis}}\] and corresponding frequency on\[y - {\text{axis}}\]. So the frequency polygon will be as follows:
Taking $1{\text{ cm on x - axis}} = 10{\text{ units and 1 cm on y - axis}} = 5{\text{ units}}$
9. Following table gives the distribution of students of sections $A$ and $B$ of a class according to the marks obtained by them.
Represent the marks of the students of both the sections on the same graph by two frequency polygons. What do you observe?
Ans: To form the frequency polygon we need to find the class marks for each class interval provided. Class mark of a particular class is the average of its upper and lower limit. so we consider the following table.
We have to plot the points of class marks versus frequency. But first we have to find the class marks where $12$frequencies will be $0$. The difference between any two consecutive class marks is $15$. Therefore, the two such class marks can be given as,
Starting point $ = $ class mark of first class interval $ - 15$
Starting point $ = 7.5 - 15 = - 7.5$
Ending point $ = $ class mark of last class interval $ + 15$
Ending point $ = 82.5 + 15 = 97.5$
The frequency polygons can be shown below:
Taking $1\,{\text{cm on x - axis}} = 10{\text{ units and 1 cm on y - axis}} = 5\,{\text{units}}$
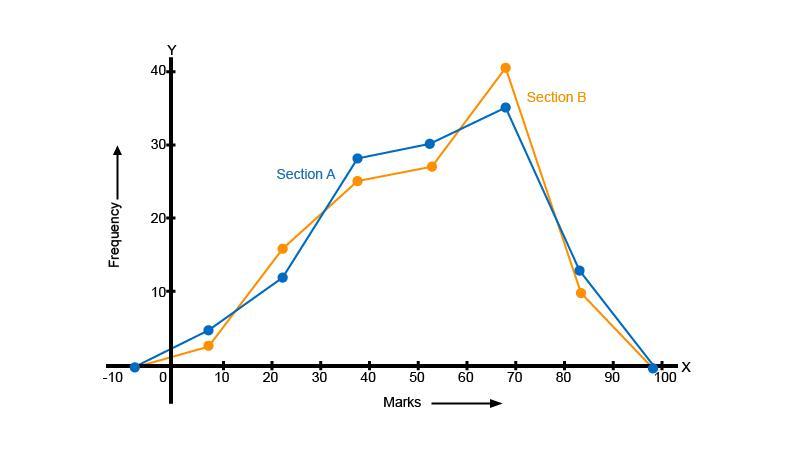
From the graph we can see that the maximum marks $82.5$ is scored by $13$ students of section ${\text{A}}$ and minimum marks $7.5$ is scored by $3$ students of section ${\text{B}}$.
10. The mean of the following is $50$.
Find the value of $a$ and hence the frequencies of $30$ and $70$.
Ans: For the given table of data the mean is given as $\overline x =\dfrac{{\sum\limits_{i = 1}^n {{f_i}{x_i}} }}{{\sum\limits_{i = 1}^n {{f_i}} }}$, where $n = 5$ (the values of $x$). The provided mean value is $50$, so we have,
$\Rightarrow 50 =\dfrac{{\left( {10 \times 17} \right) + \left( {30 \times \left( {5a + 3} \right)} \right) + \left( {50 \times 32} \right) + \left( {70 \times \left( {7a - 11} \right)} \right) + \left( {90 \times 19} $\right)}}{{17 + 5a + 3 + 32 + 7a - 11 + 19}}$
$\Rightarrow 50 =\dfrac{{640a + 2800}}{{12a + 60}}$
$\Rightarrow 600a + 3000 = 640a + 2800$
$\Rightarrow a = 5$
Substituting the value of $a$ in the required frequencies we get,
The frequency of $30 = 5a + 3 = 28$.
The frequency of $70 = 7a - 11 = 24$.
11. The mean marks (out of $100$) of boys and girls in an examination are $70$ and $73$, respectively. If the mean marks of all the students in that examination is $71$, find the ratio of the number of boys to the number of girls.
Ans: Let us assume the number of boys in the class is $x$ and the number of girls is $y$.
Now, since the mean marks of all the boys is $70$ that means the ratio of sum of marks obtained by all the boys and the total number of boys is $70$.
$ \Rightarrow $ Sum of marks obtained by all the boys $ = 70 \times x$ … $\left( i \right)$
Similarly, the mean marks of all the girls is $73$ that means the ratio of sum of marks obtained by all the girls and the total number of girls is $73$.
$ \Rightarrow $ Sum of marks obtained by all the girls $ = 73 \times y$ … $\left( {ii} \right)$
Now, the mean marks of all the students is $71$ that means the ratio of sum of marks obtained by both girls and boys and the total number of boys and girls is $71$.
$ \Rightarrow $ Sum of marks obtained by all the students (both boys and girls) $ = 71 \times \left( {x + y} \right)$ … \[\left( {iii} \right)\]
Clearly we can see that $\left( i \right) + \left( {ii} \right) = \left( {iii} \right)$, so we have,
$\Rightarrow 70x + 73y = 71\left( {x + y} \right)$
$\Rightarrow 70x + 73y = 71x + 71y$
$\Rightarrow x = 2y$
$\Rightarrow\dfrac{x}{y} =\dfrac{2}{1}$
Therefore, the ratio of the number of boys to the number of girls is $x:y = 2:1$.
12. A total of $25$ patients admitted to a hospital are tested for levels of blood sugar, $\left( {mg/dl} \right)$ and the results obtained were as follows:
87 71 83 67 85
77 69 76 65 85
85 54 70 68 80
73 78 68 85 73
81 78 81 77 75
Find the mean, median and mode $\left( {mg/dl} \right)$ of the above data.
Ans:
(i) First let us find the meaning.
We know that the mean is the ratio of the sum of observations to the number of observations. For the above data the sum of all the blood sugar levels is $1891$ and the total number of patients is $25$.
$ \Rightarrow $ Mean $ =\dfrac{{1892}}{{25}}$
$ \Rightarrow $ Mean $ = 75.64\left( {{\text{mg}}/{\text{dl}}} \right)$
(ii) Now, let us find the median.
Arranging the data in ascending order we have,
\[54\], \[65\], \[67\], \[68\], \[68\], \[69\], \[70\], \[71\], $73$, $73$, $75$, $76$
$77$, $77$, $78$, $78$, $80$, $81$, $81$, \[83\], \[85\], \[85\], \[85\], \[85\], \[85\]
We can see that the total number of patients is $25$ which is odd, so the median will be ${\left( {\dfrac{{n + 1}}{2}} \right)^{th}}$ term.
$ \Rightarrow $ Median $ = {\left( {\dfrac{{25 + 1}}{2}} \right)^{th}}$ term
$ \Rightarrow $ Median $ = {13^{th}}$ term
$ \Rightarrow $ Median $ = 77\left( {{\text{mg}}/{\text{dl}}} \right)$
(iii) Finally, let us find the mode.
The mode is the observation which appears the most in the data. We can see that $85$ appears the most number of times.
$ \Rightarrow $ Mode $ = 85\left( {{\text{mg}}/{\text{dl}}} \right)$
NCERT Exemplar Solutions Class 9 Maths Chapter 14 – Statistics and Probability
The NCERT Exemplar Class 9 Maths Chapter 14 Statistics and Probability is provided by Vedantu for the students to prepare for their exams on our website. The NCERT exemplars questions and solutions are designed in discussion with the experts following the CBSE Syllabus . They are the best source for the students to revise the chapters during their exams.
The Ncert Exemplar Explains the Following Concepts of Statistics and Probability As Follows:
The collection and presentation of data in a graphical format
Measures of central tendency
The basic approach to solve probability and problems based on it.
Advantages of NCERT Exemplar
The NCERT Exemplar Solutions can be used as a source tool for solving exercise questions of Chapter 14 by the students that are present in the NCERT book and clear their doubts as well.
The students are suggested to refer to other study materials such as exemplar books, NCERT Solutions, notes, etc. to prepare better for the final exams available on Vedantu’s website.
The students can also solve sample papers and previous year question papers to get an idea of the exam pattern, the type of questions asked from statistics and probability, and also the marking scheme.
Class 9 NCERT Exemplar Maths Book Syllabus
Chapter 1- Number Systems
Chapter 2- Polynomials
Chapter 3- Coordinate Geometry
Chapter 4 – Linear Equations in Two Variables
Chapter 5 – Introduction to Euclid’s Geometry
Chapter 6 – Lines and Angles
Chapter 7 – Triangles
Chapter 8 – Quadrilaterals
Chapter 9 – Area of parallelogram and triangle
Chapter 10 – Circles
Chapter 11 – Constructions
Chapter 12 – Heron’s Formula
Chapter 13 – Surface Areas and Volumes
Chapter 14 – Statistics and Probability
Get the solutions for Class 9 Chapter 14 NCERT Exemplar from Vedantu from Vedantu and find out how the experts have solved the problems in the exercises following the specific CBSE guidelines. Learn how to approach such problems and save your time solving them. Build a strategy to answer such questions during the board exams to score more marks and to excel. Utilize the concepts well to learn advanced mathematics in the future.


FAQs on Easy Preparation with NCERT Exemplar for Class 9 Maths Chapter 14 - Statistics and Probability (Book Solutions)
1. What is the concept of Mean in NCERT Exemplar for Class 9 Maths Chapter 14 - Statistics and Probability (Book Solutions)?
In Class 9 mathematics the mean represents the average value of the given dataset. The mean can be calculated as the sum of all the values in the dataset divided by the number of values. In other words, it is considered as the arithmetic mean. Some of the measures of mean used to find the central tendency are:
Geometric Mean
Harmonic Mean
Weighted Mean
Now, it is observed that if all the values of the dataset are the same, then all the mean i.e., the geometric, arithmetic, and harmonic mean values are the same. If the data varies, then the mean values also differ.
2. Does Vedantu provide the NCERT Exemplar for Class 9 Maths Chapter 14 - Statistics and Probability (Book Solutions)?
The students can easily download the chapter-wise NCERT Exemplar Solutions for Class 9 Maths from Vedantu’s website. The solutions are designed by the subject experts at Vedantu after conducting thorough research on each concept and topic. The PDFs of solutions are also available for free that can be downloaded and used by the students to clear their doubts instantly. The solutions are explained in detail to boost the exam preparation of Class 9 students in mathematics by understanding the concepts well. This will also ensure that the students are able to score good marks.
3. What are the main topics of the NCERT Exemplar for Class 9 Maths Chapter 14 - Statistics and Probability (Book Solutions)?
Class 9 mathematics is a crucial subject for the students to study and understand. One such chapter is statistics and probability which is taught for future Classes in advance in a basic format. The main topics of the NCERT Exemplar Solutions for Maths Class 9 Chapter 14 include–
Collection and presentation of data in graphical format
Measures of central tendency
The basic approach to probability and problems based on them.
4. Where can I download the NCERT Exemplar for Class 9 Maths Chapter 14 - Statistics and Probability (Book Solutions)?
The students can get the chapter-wise NCERT Exemplar Solutions for Class 9 Maths Chapter 14 on Vedantu’s website for free. The solutions are designed with the help of experts at Vedantu after conducting thorough research on every concept and topic. The PDFs of solutions available on Vedantu can be downloaded and used by the students to clear their doubts instantly. The NCERT Exemplar is useful for the students of higher secondary as they will get a better and deeper understanding of the topics.
5. Is NCERT Exemplar for Class 9 Maths Chapter 14 - Statistics and Probability (Book Solutions) good for students?
The topics covered in the NCERT Exemplar Class 9 create a base for a higher level of mathematics and to make that base strong the Class 9 students are advised to solve the NCERT Exemplar Class 9 Maths. It will help the students to understand the problems in a better way along with the concepts. It will not only assist students during the school level exams but also for the competitive level exams. Therefore, it is a good resource for the students to learn the insights of the subject, especially those who want to pursue advanced mathematics in their career ahead.